Logitech 2010 Annual Report Download - page 219
Download and view the complete annual report
Please find page 219 of the 2010 Logitech annual report below. You can navigate through the pages in the report by either clicking on the pages listed below, or by using the keyword search tool below to find specific information within the annual report.
ANNUAl REPORT
207
Note 19 — Other Disclosures Required by Swiss Law
Balance Sheet Items
The amounts of certain balance sheet items were as follows (in thousands):
March 31,
2010 2009
Prepayments and accrued income . . . . . . . . . . . . . . . . . . . . . . . $ 8,098 $8,733
Non-current assets ................................... $806,017 $422,853
Pension liabilities, current . . . . . . . . . . . . . . . . . . . . . . . . . . . . . $ 2,761 $2,873
Fire insurance value of property, plant and equipment . . . . . . . $ 191,600 $172,593
Statement of Income Items
Total personnel expenses amounted to $292.3 million, $282.9 million and $271.9 million in fiscal years 2010,
2009 and 2008.
Compensation and Security Ownership of Board Members and Executive Officers
In accordance with the Swiss Code of Obligations, the compensation and security ownership of members of
the Board of Directors of Logitech International S.A. and of Logitech executive officers is presented below.
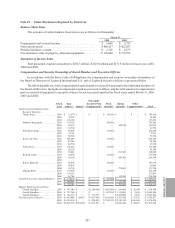
The following table sets forth compensation Logitech paid or accrued for payment to the individual members of
the Board of Directors, the highest compensation paid to an executive officer, and the total amount of compensation
paid or accrued for payment to executive officers for services performed in the fiscal years ended March 31, 2010,
2009 and 2008:
Fiscal
Year Base
Salary(1) Bonus(2)
Non-equity
Incentive Plan
Compensation(3) Stock
Awards(4) Option
Awards(4) Other
Compensation(5) Total
Non-Executive Members of the
Board of Directors:
Daniel Borel ................. 2010 $72,974 $ — $ — $ 110,580 $ — $ — $ 183,554
2009 74,882 — — — — — 74,882
2008 126,910 — — — — — 126,910
Matthew Bousquette ........... 2010 124,762 — — 109,680 — — 234,442
2009 94,533 — — — 104,850 —199,383
2008 62,750 — — — — — 62,750
Erh-Hsun Chang .............. 2010 87,098 — — 127,960 — — 215,058
2009 75,321 — — — — — 75,321
2008 58,750 — — — — — 58,750
Kee-Lock Chua............... 2010 108,284 — — 127,960 — — 236,244
2009 99,504 — — — — — 99,504
2008 68,750 — — — — — 68,750
Sally Davis .................. 2010 101,222 — — 110,580 — — 211,802
2009 95,598 — — — — — 95,598
2008 76,802 — — — 283,200 —360,002
Richard Laube................ 2010 87,098 — — 110,580 — — 197,678
2009 58,168 — — — 208,500 —266,668
2008 — — — — — — —
Robert Malcolm .............. 2010 87,098 — — 109,680 — — 196,778
2009 85,841 — — — — — 85,841
2008 54,750 — — — 279,000 —333,750
Monika Ribar ................ 2010 110,638 — — 110,580 — — 221,218
2009 107,017 — — — — — 107,017
2008 88,700 — — — 141,600 —230,300
Total Non-Executive Board Members 2010 $779,174 $ — $ — $ 917,600 $ — $ — $ 1,696,774
2009 $690,864 $ — $ — $ — $ 313,350 $ — $ 1,004,214
2008 $537,412 $ — $ — $ — $ 703,800 $ — $ 1,241,212
Highest Paid Executive Officer
Gerald Quindlen .............. 2010 $787,500 $ — $1,299,000 $1,007,600 $394,000 $26,498 $3,514,598
Gerald Quindlen .............. 2009 $787,500 $ — $ — $ 697,500 $1,151,000 $9,626 $2,645,626
Gerald Quindlen .............. 2008 $516,154 $ — $ 518,215 $ — $3,999,000 $8,697 $5,042,066
Total Executive Officers(6) ......... 2010 $3,634,808 $40,467 $4,557,000 $2,641,020 $2,783,850 $83,872 $13,741,017
2009 $3,340,962 $ — $ 584,403 $1,918,125 $3,585,950 $146,586 $9,576,026
2008 $3,095,385 $150,000 $2,531,572 $ — $8,108,500 $88,801 $13,974,258


