Logitech 2010 Annual Report Download - page 191
Download and view the complete annual report
Please find page 191 of the 2010 Logitech annual report below. You can navigate through the pages in the report by either clicking on the pages listed below, or by using the keyword search tool below to find specific information within the annual report.-
 1
1 -
2
-
3
-
4
-
5
-
6
-
7
-
8
-
9
-
10
-
11
-
12
-
13
-
14
-
15
-
16
-
17
-
18
-
19
-
20
-
21
-
22
-
23
-
24
-
25
-
26
-
27
-
28
-
29
-
30
-
31
-
32
-
33
-
34
-
35
-
36
-
37
-
38
-
39
-
40
-
41
-
42
-
43
-
44
-
45
-
46
-
47
-
48
-
49
-
50
-
51
-
52
-
53
-
54
-
55
-
56
-
57
-
58
-
59
-
60
-
61
-
62
-
63
-
64
-
65
-
66
-
67
-
68
-
69
-
70
-
71
-
72
-
73
-
74
-
75
-
76
-
77
-
78
-
79
-
80
-
81
-
82
-
83
-
84
-
85
-
86
-
87
-
88
-
89
-
90
-
91
-
92
-
93
-
94
-
95
-
96
-
97
-
98
-
99
-
100
-
101
-
102
-
103
-
104
-
105
-
106
-
107
-
108
-
109
-
110
-
111
-
112
-
113
-
114
-
115
-
116
-
117
-
118
-
119
-
120
-
121
-
122
-
123
-
124
-
125
-
126
-
127
-
128
-
129
-
130
-
131
-
132
-
133
-
134
-
135
-
136
-
137
-
138
-
139
-
140
-
141
-
142
-
143
-
144
-
145
-
146
-
147
-
148
-
149
-
150
-
151
-
152
-
153
-
154
-
155
-
156
-
157
-
158
-
159
-
160
-
161
-
162
-
163
-
164
-
165
-
166
-
167
-
168
-
169
-
170
-
171
-
172
-
173
-
174
-
175
-
176
-
177
-
178
-
179
-
180
-
 181
181 -
 182
182 -
 183
183 -
 184
184 -
 185
185 -
 186
186 -
 187
187 -
 188
188 -
 189
189 -
 190
190 -
 191
191 -
 192
192 -
 193
193 -
 194
194 -
 195
195 -
 196
196 -
 197
197 -
 198
198 -
 199
199 -
 200
200 -
 201
201 -
202
-
203
-
204
-
205
-
206
-
207
-
208
-
209
-
210
-
211
-
212
-
213
-
214
-
215
-
216
-
217
-
218
-
219
-
220
-
221
-
222
-
223
-
224
-
225
-
226
-
227
-
228
-
229
-
230
-
231
-
232
-
233
-
234
-
235
-
236
 |
 |

ANNUAl REPORT
179
In January 2010, the FASB published ASU 2010-06, Improving Disclosures about Fair Value Measurement,
which requires additional disclosures regarding the activity in fair value measurements classified as Level 3 in the
fair value hierarchy. Disclosure of activity in Level 3 fair value measurements is required for fiscal years beginning
after December 15, 2010. Early adoption is permitted. We will provide these disclosures beginning in the first
quarter of fiscal year 2011, when such activity occurs.
In April 2010, the FASB published ASU 2010-13, Effect of Denominating the Exercise Price of a Share-Based
Payment Award in the Currency of the Market in Which the Underlying Equity Security Trades. The ASU provides
that a share-based payment award with an exercise price denominated in the currency of a market in which a
substantial portion of the entity’s equity shares trades should not be considered to contain a condition that is not a
market, performance, or service condition. Therefore, an entity would not classify such an award as a liability if it
otherwise qualifies as equity. The ASU is effective for fiscal years, and interim periods within those fiscal years,
beginning on or after December 15, 2010. Our adoption of ASU 2010-13 in the first quarter of fiscal year 2011 will
not impact the Company’s consolidated financial statements.
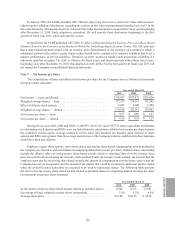
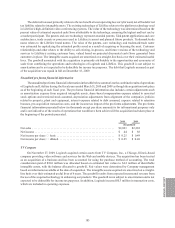
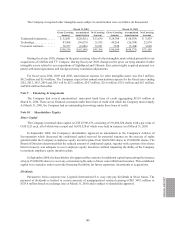
Note 3 — Net Income per Share
The computations of basic and diluted net income per share for the Company were as follows (in thousands
except per share amounts):
Year ended March 31,
2010 2009 2008
Net income — basic and diluted. . . . . . . . . . . . . . . . . . . . . . . . . . . . . . . . . . . $64,957 $107,032 $231,026
Weighted average shares — basic . . . . . . . . . . . . . . . . . . . . . . . . . . . . . . . . . 177,279 178,811 181,362
Effect of dilutive stock options .................................... 2,061 4,100 6,580
Weighted average shares — diluted ................................ 179,340 182,911 187,942
Net income per share — basic .................................... $0.37 $0.60 $1.27
Net income per share — diluted ................................... $0.36 $0.59 $1.23
During fiscal years 2010, 2009 and 2008, 15,186,997, 10,567,217 and 3,957,572 share equivalents attributable
to outstanding stock options and RSUs were excluded from the calculation of diluted net income per share because
the combined exercise price, average unamortized fair value and assumed tax benefits upon exercise of these
options and RSUs were greater than the average market price of the Company’s shares, and therefore their inclusion
would have been anti-dilutive.
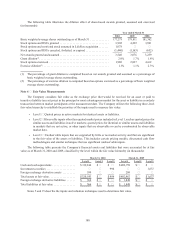
Employee equity share options, non-vested shares and similar share-based compensation awards granted by
the Company are treated as potential shares in computing diluted net income per share. Diluted shares outstanding
include the dilutive effect of in-the-money share-based awards which is calculated based on the average share
price for each fiscal period using the treasury stock method. Under the treasury stock method, the amount that the
employee must pay for exercising share-based awards, the amount of compensation cost for future service that the
Company has not yet recognized, and the amount of tax impact that would be recorded in additional paid-in capital
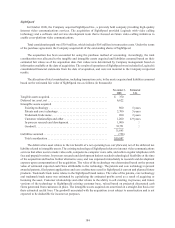
when the award becomes deductible are assumed to be used to repurchase shares. The following table presents
the effect of in-the-money share-based awards treated as potential shares in computing diluted earnings per share
(in thousands except per share amounts):
Year Ended March 31
2010 2009 2008
In-the-money employee share-based awards treated as potential shares . . . . 6,945 9,313 15,881
Percentage of basic weighted average shares outstanding ................ 3.9%5.2%8.8%
Average share price. . . . . . . . . . . . . . . . . . . . . . . . . . . . . . . . . . . . . . . . . . . . . . $16.06 $20.55 $28.74