Logitech 2010 Annual Report Download - page 137
Download and view the complete annual report
Please find page 137 of the 2010 Logitech annual report below. You can navigate through the pages in the report by either clicking on the pages listed below, or by using the keyword search tool below to find specific information within the annual report.-
 1
1 -
2
-
3
-
4
-
5
-
6
-
7
-
8
-
9
-
10
-
11
-
12
-
13
-
14
-
15
-
16
-
17
-
18
-
19
-
20
-
21
-
22
-
23
-
24
-
25
-
26
-
27
-
28
-
29
-
30
-
31
-
32
-
33
-
34
-
35
-
36
-
37
-
38
-
39
-
40
-
41
-
42
-
43
-
44
-
45
-
46
-
47
-
48
-
49
-
50
-
51
-
52
-
53
-
54
-
55
-
56
-
57
-
58
-
59
-
60
-
61
-
62
-
63
-
64
-
65
-
66
-
67
-
68
-
69
-
70
-
71
-
72
-
73
-
74
-
75
-
76
-
77
-
78
-
79
-
80
-
81
-
82
-
83
-
84
-
85
-
86
-
87
-
88
-
89
-
90
-
91
-
92
-
93
-
94
-
95
-
96
-
97
-
98
-
99
-
100
-
101
-
102
-
103
-
104
-
105
-
106
-
107
-
108
-
109
-
110
-
111
-
112
-
113
-
114
-
115
-
116
-
117
-
118
-
119
-
120
-
121
-
122
-
123
-
124
-
125
-
126
-
 127
127 -
 128
128 -
 129
129 -
 130
130 -
 131
131 -
 132
132 -
 133
133 -
 134
134 -
 135
135 -
 136
136 -
 137
137 -
 138
138 -
 139
139 -
 140
140 -
 141
141 -
 142
142 -
 143
143 -
 144
144 -
 145
145 -
 146
146 -
 147
147 -
148
-
149
-
150
-
151
-
152
-
153
-
154
-
155
-
156
-
157
-
158
-
159
-
160
-
161
-
162
-
163
-
164
-
165
-
166
-
167
-
168
-
169
-
170
-
171
-
172
-
173
-
174
-
175
-
176
-
177
-
178
-
179
-
180
-
181
-
182
-
183
-
184
-
185
-
186
-
187
-
188
-
189
-
190
-
191
-
192
-
193
-
194
-
195
-
196
-
197
-
198
-
199
-
200
-
201
-
202
-
203
-
204
-
205
-
206
-
207
-
208
-
209
-
210
-
211
-
212
-
213
-
214
-
215
-
216
-
217
-
218
-
219
-
220
-
221
-
222
-
223
-
224
-
225
-
226
-
227
-
228
-
229
-
230
-
231
-
232
-
233
-
234
-
235
-
236
 |
 |

125
ANNUAl REPORT
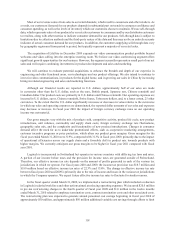
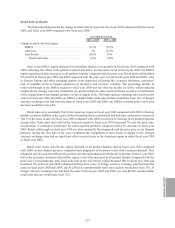
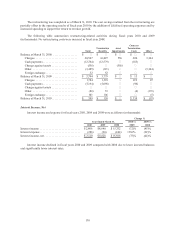
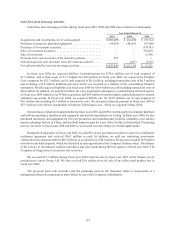
Retail Sales by Region
The following table presents the change in retail sales by region for fiscal year 2010 compared with fiscal year
2009, and fiscal year 2009 compared with fiscal year 2008:
Year Ended March 31,
2010 vs 2009 2009 vs 2008
Change in retail sales by region:
EMEA ................................. (11)% (11)%
Americas ............................... 1% (15)%
Asia Pacific ............................. (16)% 16%
Total retail sales ....................... (8)% (9)%
Sales in the EMEA region decreased in all product families except audio in fiscal year 2010 compared with
2009, reflecting the effects of the global economic downturn. For the same reason in fiscal year 2009, the EMEA
region experienced sales decreases in all product families compared with the prior year. Retail units sold declined
5% and 8% in fiscal years 2010 and 2009 compared with the prior year. In both fiscal years 2010 and 2009, sales
in Eastern Europe and other emerging markets were depressed, reflecting the economic downturn, customers’
lack of available credit to finance purchases of inventory, and currency volatility. The percentage decline in
retail sell-through in the EMEA region for fiscal year 2010 was less than the decline in sell-in, which indicates
comparatively stronger consumer demand for our products than our sales results reflected, as well as a continuance
of the realignment of our channel partners’ weeks of supply levels. If foreign currency exchange rates had been the
same in fiscal years 2010 and 2009, our EMEA constant dollar retail sales decline would have been 12%. If foreign
currency exchange rates had been the same in fiscal years 2009 and 2008, our EMEA constant dollar retail sales
decrease would have been 8%.
Retail sales were essentially flat in the Americas region in fiscal year 2010 compared with 2009, reflecting
modest economic stability in the region. Sales of pointing devices, keyboards and desktops, and remotes increased.
The 15% decrease in sales in fiscal year 2009 compared with 2008 was driven by declines in all product families
except video. Total retail units sold in the Americas region in fiscal year 2010 increased 7% over the prior year,
an indication of consumers’ preference for value-segment products, compared with a 5% decrease in fiscal year
2009. Retail sell-through in fiscal year 2010 was also essentially flat compared with the prior year, as our channel
partners, during the first half of the year, completed the realignment of their weeks of supply levels. Foreign
currency exchange rates had no significant effect on retail sales in the Americas region in either fiscal year 2010
or fiscal year 2009.
Retail sales in the Asia Pacific region declined in all product families during fiscal year 2010 compared
with 2009, as our channel partners completed their alignment of inventory levels with consumer demand. This
alignment activity was also reflected by positive sell-through compared with the sell-in decline. In fiscal year 2009,
before the economic downturn affected the region, retail sales increased in all product families compared with the
prior year. Correspondingly, total retail units sold in the Asia Pacific region declined 10% in fiscal year 2010 and
increased 11% in fiscal year 2009 compared with the prior years. If foreign currency exchange rates had been the
same in fiscal years 2010 and 2009, our Asia Pacific constant dollar retail sales decline would have been 17%. If
foreign currency exchange rates had been the same in fiscal years 2009 and 2008, our Asia Pacific constant dollar
retail sales increase would have been 12%.