Logitech 2010 Annual Report Download - page 215
Download and view the complete annual report
Please find page 215 of the 2010 Logitech annual report below. You can navigate through the pages in the report by either clicking on the pages listed below, or by using the keyword search tool below to find specific information within the annual report.-
 1
1 -
2
-
3
-
4
-
5
-
6
-
7
-
8
-
9
-
10
-
11
-
12
-
13
-
14
-
15
-
16
-
17
-
18
-
19
-
20
-
21
-
22
-
23
-
24
-
25
-
26
-
27
-
28
-
29
-
30
-
31
-
32
-
33
-
34
-
35
-
36
-
37
-
38
-
39
-
40
-
41
-
42
-
43
-
44
-
45
-
46
-
47
-
48
-
49
-
50
-
51
-
52
-
53
-
54
-
55
-
56
-
57
-
58
-
59
-
60
-
61
-
62
-
63
-
64
-
65
-
66
-
67
-
68
-
69
-
70
-
71
-
72
-
73
-
74
-
75
-
76
-
77
-
78
-
79
-
80
-
81
-
82
-
83
-
84
-
85
-
86
-
87
-
88
-
89
-
90
-
91
-
92
-
93
-
94
-
95
-
96
-
97
-
98
-
99
-
100
-
101
-
102
-
103
-
104
-
105
-
106
-
107
-
108
-
109
-
110
-
111
-
112
-
113
-
114
-
115
-
116
-
117
-
118
-
119
-
120
-
121
-
122
-
123
-
124
-
125
-
126
-
127
-
128
-
129
-
130
-
131
-
132
-
133
-
134
-
135
-
136
-
137
-
138
-
139
-
140
-
141
-
142
-
143
-
144
-
145
-
146
-
147
-
148
-
149
-
150
-
151
-
152
-
153
-
154
-
155
-
156
-
157
-
158
-
159
-
160
-
161
-
162
-
163
-
164
-
165
-
166
-
167
-
168
-
169
-
170
-
171
-
172
-
173
-
174
-
175
-
176
-
177
-
178
-
179
-
180
-
181
-
182
-
183
-
184
-
185
-
186
-
187
-
188
-
189
-
190
-
191
-
192
-
193
-
194
-
195
-
196
-
197
-
198
-
199
-
200
-
201
-
202
-
203
-
204
-
 205
205 -
 206
206 -
 207
207 -
 208
208 -
 209
209 -
 210
210 -
 211
211 -
 212
212 -
 213
213 -
 214
214 -
 215
215 -
 216
216 -
 217
217 -
 218
218 -
 219
219 -
 220
220 -
 221
221 -
 222
222 -
 223
223 -
 224
224 -
 225
225 -
226
-
227
-
228
-
229
-
230
-
231
-
232
-
233
-
234
-
235
-
236
 |
 |

ANNUAl REPORT
203
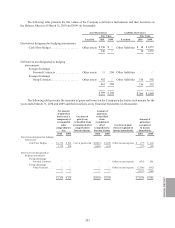
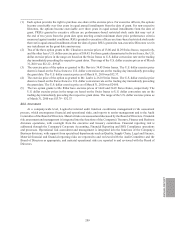
The following table presents the fair values of the Company’s derivative instruments and their locations on
the Balance Sheet as of March 31, 2010 and 2009 (in thousands):
Asset Derivatives Liability Derivatives
Fair Value Fair Value
Location 2010 2009 Location 2010 2009
Derivatives designated as hedging instruments:
Cash Flow Hedges ................... Other assets $136 $ — Other liabilities $10 $1,257
136 —10 1,257
Derivatives not designated as hedging
instruments:
Foreign Exchange
Forward Contracts ................ Other assets 11 208 Other liabilities — —
Foreign Exchange
Swap Contracts................... Other assets 452 — Other liabilities 356 592
463 208 356 592
$ 599 $208 $366 $1,849
The following table presents the amounts of gains and losses on the Company’s derivative instruments for the
years ended March 31, 2010 and 2009 and their locations on its Financial Statements (in thousands):
Net amount
of gain/(loss)
deferred as a
component of
accumulated
other
comprehensive
loss
Location of
gain/(Loss)
reclassified from
accumulated other
comprehensive
loss into income
Amount of
gain/(loss)
reclassified
from
accumulated
other
comprehensive
loss into income
Location of gain/
(loss) recognized in
income immediately
Amount of
gain/(loss)
recognized
in income
immediately
2010 2009 2010 2009 2010 2009
Derivatives designated as hedging
instruments:
Cash Flow Hedges . . . . . . $ 1,178 $ 216 Cost of goods sold $(5,615) $1,678 Other income/expense $ (57) $ (12)
1,178216 (5,615)1,678 (57)(12)
Derivatives not designated as
hedging instruments:
Foreign Exchange
Forward Contracts. . . — — — — Other income/expense (831)208
Foreign Exchange
Swap Contracts ..... — — — — Other income/expense (2,306)(592)
— — — — (3,137)(384)
$1,178 $ 216 $(5,615) $1,678 $(3,194) $ (396)