Logitech 2010 Annual Report Download - page 160
Download and view the complete annual report
Please find page 160 of the 2010 Logitech annual report below. You can navigate through the pages in the report by either clicking on the pages listed below, or by using the keyword search tool below to find specific information within the annual report.-
 1
1 -
2
-
3
-
4
-
5
-
6
-
7
-
8
-
9
-
10
-
11
-
12
-
13
-
14
-
15
-
16
-
17
-
18
-
19
-
20
-
21
-
22
-
23
-
24
-
25
-
26
-
27
-
28
-
29
-
30
-
31
-
32
-
33
-
34
-
35
-
36
-
37
-
38
-
39
-
40
-
41
-
42
-
43
-
44
-
45
-
46
-
47
-
48
-
49
-
50
-
51
-
52
-
53
-
54
-
55
-
56
-
57
-
58
-
59
-
60
-
61
-
62
-
63
-
64
-
65
-
66
-
67
-
68
-
69
-
70
-
71
-
72
-
73
-
74
-
75
-
76
-
77
-
78
-
79
-
80
-
81
-
82
-
83
-
84
-
85
-
86
-
87
-
88
-
89
-
90
-
91
-
92
-
93
-
94
-
95
-
96
-
97
-
98
-
99
-
100
-
101
-
102
-
103
-
104
-
105
-
106
-
107
-
108
-
109
-
110
-
111
-
112
-
113
-
114
-
115
-
116
-
117
-
118
-
119
-
120
-
121
-
122
-
123
-
124
-
125
-
126
-
127
-
128
-
129
-
130
-
131
-
132
-
133
-
134
-
135
-
136
-
137
-
138
-
139
-
140
-
141
-
142
-
143
-
144
-
145
-
146
-
147
-
148
-
149
-
 150
150 -
 151
151 -
 152
152 -
 153
153 -
 154
154 -
 155
155 -
 156
156 -
 157
157 -
 158
158 -
 159
159 -
 160
160 -
 161
161 -
 162
162 -
 163
163 -
 164
164 -
 165
165 -
 166
166 -
 167
167 -
 168
168 -
 169
169 -
 170
170 -
171
-
172
-
173
-
174
-
175
-
176
-
177
-
178
-
179
-
180
-
181
-
182
-
183
-
184
-
185
-
186
-
187
-
188
-
189
-
190
-
191
-
192
-
193
-
194
-
195
-
196
-
197
-
198
-
199
-
200
-
201
-
202
-
203
-
204
-
205
-
206
-
207
-
208
-
209
-
210
-
211
-
212
-
213
-
214
-
215
-
216
-
217
-
218
-
219
-
220
-
221
-
222
-
223
-
224
-
225
-
226
-
227
-
228
-
229
-
230
-
231
-
232
-
233
-
234
-
235
-
236
 |
 |

148
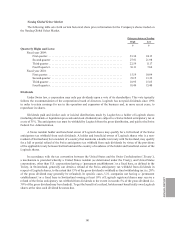
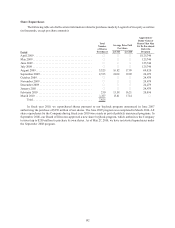
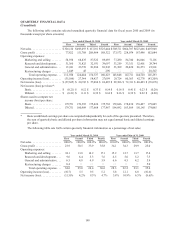
QUARTERLY FINANCIAL DATA
(Unaudited)
The following table contains selected unaudited quarterly financial data for fiscal years 2010 and 2009 (in
thousands except per share amounts):
Year ended March 31, 2010 Year ended March 31, 2009
First Second Third Fourth First Second Third Fourth
Net sales..................... $326,110 $498,093 $617,101 $525,444 $508,711 $664,707 $627,466 $407,948
Gross profit .................. 77,822 151,788 208,964 188,322 173,572 228,074 187,496 102,084
Operating expenses:
Marketing and selling ....... 58,938 68,835 87,322 89,693 77,280 84,740 86,046 71,101
Research and development.... 31,360 31,825 32,931 39,697 33,259 33,351 32,401 29,744
General and administrative ... 21,181 23,739 30,284 30,943 33,309 29,620 26,273 23,901
Restructuring charges ....... 1,449 45 —290 — — — 20,547
Total operating expense ... 112,928 124,444 150,537 160,623 143,848 147,711 144,720 145,293
Operating income (loss)......... (35,106)27,344 58,427 27,699 29,724 80,363 42,776 (43,209)
Net income (loss) .............. $(37,365) $ 20,743 $57,086 $24,493 $29,306 $72,311 $40,493 $(35,078)
Net income (loss) per share*:
Basic..................... $(0.21) $ 0.12 $0.33 $0.14 $0.16 $0.41 $0.23 $(0.20)
Diluted ................... $(0.21) $ 0.11 $0.32 $0.14 $0.16 $0.39 $0.22 $(0.20)
Shares used to compute net
income (loss) per share:
Basic..................... 179,751 178,395 175,426 175,738 179,046 178,630 178,497 179,065
Diluted ................... 179,751 180,989 177,668 177,967 184,692 183,509 181,145 179,065
* Basic and diluted earnings per share are computed independently for each of the quarters presented. Therefore,
the sum of quarterly basic and diluted per share information may not equal annual basic and diluted earnings
per share.
The following table sets forth certain quarterly financial information as a percentage of net sales:
Year ended March 31, 2010 Year ended March 31, 2009
First Second Third Fourth First Second Third Fourth
Net sales..................... 100.0%100.0%100.0%100.0%100.0%100.0%100.0%100.0%
Gross profit .................. 23.9 30.5 33.9 35.8 34.1 34.3 29.9 25.0
Operating expenses:
Marketing and selling ....... 18.1 13.8 14.2 17.1 15.2 12.7 13.7 17.4
Research and development.... 9.6 6.4 5.3 7.6 6.5 5.0 5.2 7.3
General and administrative ... 6.5 4.8 4.9 5.9 6.6 4.5 4.2 5.9
Restructuring charges ....... 0.4 — — — — — — 5.0
Total operating expense ... 34.6 25.0 24.4 30.6 28.3 22.2 23.1 35.6
Operating income (loss)......... (10.7)5.5 9.5 5.2 5.8 12.1 6.8 (10.6)
Net income (loss) .............. (11.5)% 4.2%9.3%4.7%5.8%10.9%6.5%(8.6)%