Logitech 2010 Annual Report Download - page 155
Download and view the complete annual report
Please find page 155 of the 2010 Logitech annual report below. You can navigate through the pages in the report by either clicking on the pages listed below, or by using the keyword search tool below to find specific information within the annual report.-
 1
1 -
2
-
3
-
4
-
5
-
6
-
7
-
8
-
9
-
10
-
11
-
12
-
13
-
14
-
15
-
16
-
17
-
18
-
19
-
20
-
21
-
22
-
23
-
24
-
25
-
26
-
27
-
28
-
29
-
30
-
31
-
32
-
33
-
34
-
35
-
36
-
37
-
38
-
39
-
40
-
41
-
42
-
43
-
44
-
45
-
46
-
47
-
48
-
49
-
50
-
51
-
52
-
53
-
54
-
55
-
56
-
57
-
58
-
59
-
60
-
61
-
62
-
63
-
64
-
65
-
66
-
67
-
68
-
69
-
70
-
71
-
72
-
73
-
74
-
75
-
76
-
77
-
78
-
79
-
80
-
81
-
82
-
83
-
84
-
85
-
86
-
87
-
88
-
89
-
90
-
91
-
92
-
93
-
94
-
95
-
96
-
97
-
98
-
99
-
100
-
101
-
102
-
103
-
104
-
105
-
106
-
107
-
108
-
109
-
110
-
111
-
112
-
113
-
114
-
115
-
116
-
117
-
118
-
119
-
120
-
121
-
122
-
123
-
124
-
125
-
126
-
127
-
128
-
129
-
130
-
131
-
132
-
133
-
134
-
135
-
136
-
137
-
138
-
139
-
140
-
141
-
142
-
143
-
144
-
 145
145 -
 146
146 -
 147
147 -
 148
148 -
 149
149 -
 150
150 -
 151
151 -
 152
152 -
 153
153 -
 154
154 -
 155
155 -
 156
156 -
 157
157 -
 158
158 -
 159
159 -
 160
160 -
 161
161 -
 162
162 -
 163
163 -
 164
164 -
 165
165 -
166
-
167
-
168
-
169
-
170
-
171
-
172
-
173
-
174
-
175
-
176
-
177
-
178
-
179
-
180
-
181
-
182
-
183
-
184
-
185
-
186
-
187
-
188
-
189
-
190
-
191
-
192
-
193
-
194
-
195
-
196
-
197
-
198
-
199
-
200
-
201
-
202
-
203
-
204
-
205
-
206
-
207
-
208
-
209
-
210
-
211
-
212
-
213
-
214
-
215
-
216
-
217
-
218
-
219
-
220
-
221
-
222
-
223
-
224
-
225
-
226
-
227
-
228
-
229
-
230
-
231
-
232
-
233
-
234
-
235
-
236
 |
 |
143
ANNUAl REPORT
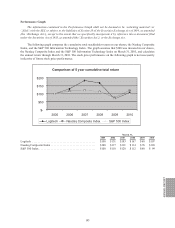
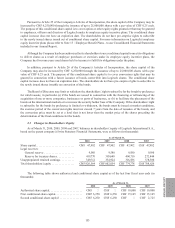
Performance Graph
The information contained in the Performance Graph shall not be deemed to be “soliciting material” or
“filed” with the SEC or subject to the liabilities of Section 18 of the Securities Exchange Act of 1934, as amended
(the “Exchange Act”), except to the extent that we specifically incorporate it by reference into a document filed
under the Securities Act of 1933, as amended (the “Securities Act”), or the Exchange Act.
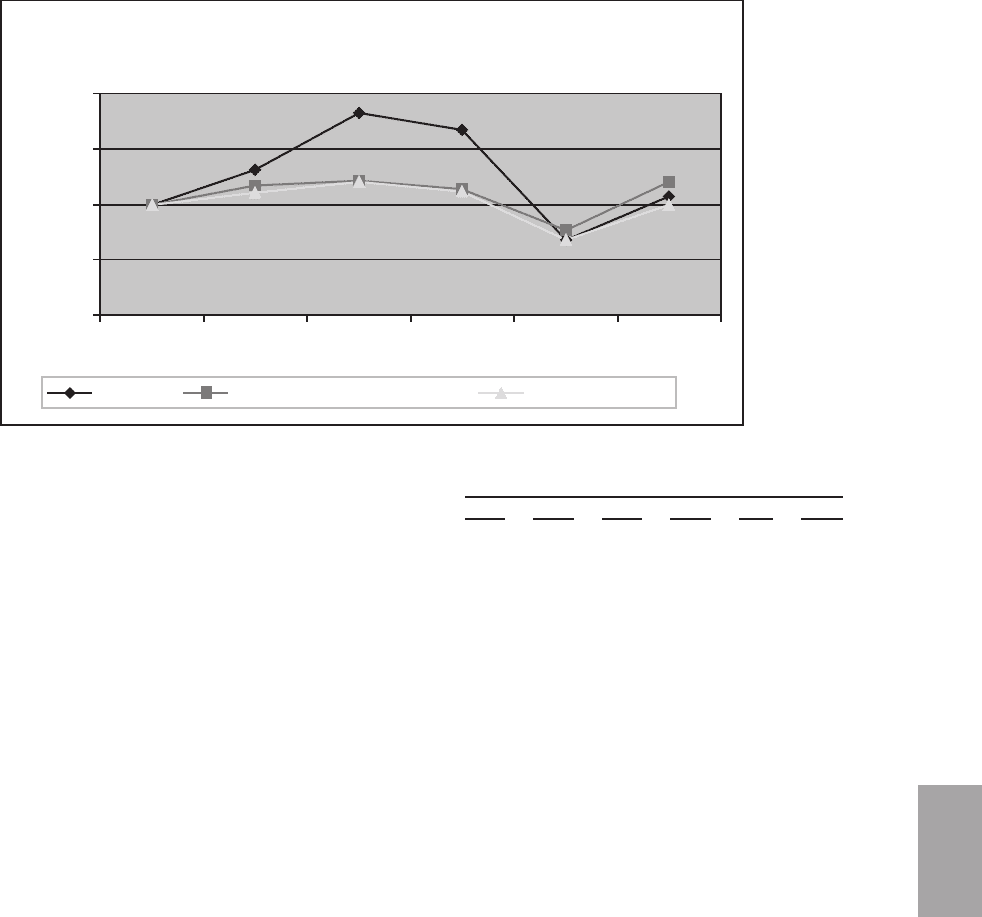
The following graph compares the cumulative total stockholder return on our shares, the Nasdaq Composite
Index, and the S&P 500 Information Technology Index. The graph assumes that $100 was invested in our shares,
the Nasdaq Composite Index and the S&P 500 Information Technology Index on March 31, 2005, and calculates
the annual return through March 31, 2010. The stock price performance on the following graph is not necessarily
indicative of future stock price performance.
Logitech Nasdaq Composite Index S&P 500 Index
Comparison of 5 year cumulative total return
$-
$50
$100
$150
$200
2005 2006 2007 2008 2009 2010
March 31,
2005 2006 2007 2008 2009 2010
Logitech ............................................ $ 100 $ 131 $ 183 $ 167 $ 68 $ 107
Nasdaq Composite Index ............................... $100 $117 $121 $114 $76 $120
S&P 500 Index ....................................... $100 $110 $120 $112 $68 $99