Logitech 2010 Annual Report Download - page 133
Download and view the complete annual report
Please find page 133 of the 2010 Logitech annual report below. You can navigate through the pages in the report by either clicking on the pages listed below, or by using the keyword search tool below to find specific information within the annual report.-
 1
1 -
2
-
3
-
4
-
5
-
6
-
7
-
8
-
9
-
10
-
11
-
12
-
13
-
14
-
15
-
16
-
17
-
18
-
19
-
20
-
21
-
22
-
23
-
24
-
25
-
26
-
27
-
28
-
29
-
30
-
31
-
32
-
33
-
34
-
35
-
36
-
37
-
38
-
39
-
40
-
41
-
42
-
43
-
44
-
45
-
46
-
47
-
48
-
49
-
50
-
51
-
52
-
53
-
54
-
55
-
56
-
57
-
58
-
59
-
60
-
61
-
62
-
63
-
64
-
65
-
66
-
67
-
68
-
69
-
70
-
71
-
72
-
73
-
74
-
75
-
76
-
77
-
78
-
79
-
80
-
81
-
82
-
83
-
84
-
85
-
86
-
87
-
88
-
89
-
90
-
91
-
92
-
93
-
94
-
95
-
96
-
97
-
98
-
99
-
100
-
101
-
102
-
103
-
104
-
105
-
106
-
107
-
108
-
109
-
110
-
111
-
112
-
113
-
114
-
115
-
116
-
117
-
118
-
119
-
120
-
121
-
122
-
 123
123 -
 124
124 -
 125
125 -
 126
126 -
 127
127 -
 128
128 -
 129
129 -
 130
130 -
 131
131 -
 132
132 -
 133
133 -
 134
134 -
 135
135 -
 136
136 -
 137
137 -
 138
138 -
 139
139 -
 140
140 -
 141
141 -
 142
142 -
 143
143 -
144
-
145
-
146
-
147
-
148
-
149
-
150
-
151
-
152
-
153
-
154
-
155
-
156
-
157
-
158
-
159
-
160
-
161
-
162
-
163
-
164
-
165
-
166
-
167
-
168
-
169
-
170
-
171
-
172
-
173
-
174
-
175
-
176
-
177
-
178
-
179
-
180
-
181
-
182
-
183
-
184
-
185
-
186
-
187
-
188
-
189
-
190
-
191
-
192
-
193
-
194
-
195
-
196
-
197
-
198
-
199
-
200
-
201
-
202
-
203
-
204
-
205
-
206
-
207
-
208
-
209
-
210
-
211
-
212
-
213
-
214
-
215
-
216
-
217
-
218
-
219
-
220
-
221
-
222
-
223
-
224
-
225
-
226
-
227
-
228
-
229
-
230
-
231
-
232
-
233
-
234
-
235
-
236
 |
 |

121
ANNUAl REPORT
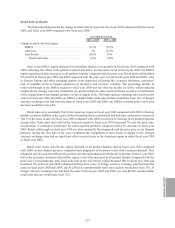
As of March 31, 2010, one customer represented 14% of total accounts receivable. The customers comprising
the ten highest outstanding trade receivable balances accounted for approximately 58% of total accounts receivable as
of March 31, 2010. A deterioration of a significant customer’s financial condition could cause actual write-offs to be
materially different from the estimated allowance. If any of these customers’ receivable balances should be deemed
uncollectible or if actual write-offs are higher than historical experience, we would have to make adjustments to our
allowance for doubtful accounts, which could result in an increase in the Company’s operating expenses.
Inventory Valuation
The Company must order components for its products and build inventory in advance of customer orders.
Further, our industry is characterized by rapid technological change, short-term customer commitments and rapid
changes in demand.
We record inventories at the lower of cost or market value and record write-downs of inventories which are
obsolete or in excess of anticipated demand or market value. A review of inventory is performed each fiscal quarter
that considers factors including the marketability and product life cycle stage, product development plans, component
cost trends, demand forecasts and current sales levels. We identify inventory exposures by comparing inventory on
hand, in the channel and on order to historical and forecasted sales over six month periods. Inventory on hand which
is not expected to be sold or utilized based on review of forecasted sales and utilization is considered excess, and
we recognize the write-off in cost of sales at the time of such determination. At the time of loss recognition, a new,
lower-cost basis for that inventory is established and subsequent changes in facts and circumstances would not result
in an increase in the cost basis. If there were an abrupt and substantial decline in demand for Logitech’s products or
an unanticipated change in technological or customer requirements, we may be required to record additional write-
downs which could adversely affect gross margins in the period when the write-downs are recorded.
Share-Based Compensation Expense
Share-based compensation expense includes compensation expense, reduced for estimated forfeitures, for
awards granted after April 1, 2006 based on the grant-date fair value. The grant date fair value for stock options
and stock purchase rights is estimated using the Black-Scholes-Merton option-pricing valuation model. The grant
date fair value of restricted stock units (“RSUs”) which vest upon meeting certain market conditions is estimated
using the Monte-Carlo simulation method. The grant date fair value of time-based RSUs is calculated based on the
share market price on the date of grant. For stock options and restricted stock assumed by Logitech when LifeSize
was acquired, the grant date used to estimate fair value is deemed to be December 11, 2009, the date of acquisition.
Compensation expense for awards granted or assumed after April 1, 2006 is recognized on a straight-line basis over
the service period of the award. For share-based compensation awards granted prior to but not yet vested as of April
1, 2006, share-based compensation expense is based on the grant-date fair value estimated using the Black-Scholes-
Merton option-pricing valuation model reduced for estimated forfeitures, and recognized on a straight-line basis
over the service period for each separately vesting portion of the award. See Note 13-Employee Benefit Plans in the
Notes to Consolidated Financial Statements for further discussion of share-based compensation.
Our estimates of share-based compensation expense require a number of complex and subjective assumptions
including our stock price volatility, employee exercise patterns, future forfeitures, dividend yield, related tax effects
and the selection of an appropriate fair value model. We estimate expected share price volatility based on historical
volatility using daily prices over the term of past options, RSUs or purchase offerings, as we consider historical share
price volatility as most representative of future volatility. We estimate expected life based on historical settlement
rates, which we believe are most representative of future exercise and post-vesting termination behaviors. We use
historical data to estimate pre-vesting forfeitures, and we record share-based compensation expense only for those
awards that are expected to vest. The dividend yield assumption is based on the Company’s history and future
expectations of dividend payouts.