Logitech 2010 Annual Report Download - page 143
Download and view the complete annual report
Please find page 143 of the 2010 Logitech annual report below. You can navigate through the pages in the report by either clicking on the pages listed below, or by using the keyword search tool below to find specific information within the annual report.-
 1
1 -
2
-
3
-
4
-
5
-
6
-
7
-
8
-
9
-
10
-
11
-
12
-
13
-
14
-
15
-
16
-
17
-
18
-
19
-
20
-
21
-
22
-
23
-
24
-
25
-
26
-
27
-
28
-
29
-
30
-
31
-
32
-
33
-
34
-
35
-
36
-
37
-
38
-
39
-
40
-
41
-
42
-
43
-
44
-
45
-
46
-
47
-
48
-
49
-
50
-
51
-
52
-
53
-
54
-
55
-
56
-
57
-
58
-
59
-
60
-
61
-
62
-
63
-
64
-
65
-
66
-
67
-
68
-
69
-
70
-
71
-
72
-
73
-
74
-
75
-
76
-
77
-
78
-
79
-
80
-
81
-
82
-
83
-
84
-
85
-
86
-
87
-
88
-
89
-
90
-
91
-
92
-
93
-
94
-
95
-
96
-
97
-
98
-
99
-
100
-
101
-
102
-
103
-
104
-
105
-
106
-
107
-
108
-
109
-
110
-
111
-
112
-
113
-
114
-
115
-
116
-
117
-
118
-
119
-
120
-
121
-
122
-
123
-
124
-
125
-
126
-
127
-
128
-
129
-
130
-
131
-
132
-
 133
133 -
 134
134 -
 135
135 -
 136
136 -
 137
137 -
 138
138 -
 139
139 -
 140
140 -
 141
141 -
 142
142 -
 143
143 -
 144
144 -
 145
145 -
 146
146 -
 147
147 -
 148
148 -
 149
149 -
 150
150 -
 151
151 -
 152
152 -
 153
153 -
154
-
155
-
156
-
157
-
158
-
159
-
160
-
161
-
162
-
163
-
164
-
165
-
166
-
167
-
168
-
169
-
170
-
171
-
172
-
173
-
174
-
175
-
176
-
177
-
178
-
179
-
180
-
181
-
182
-
183
-
184
-
185
-
186
-
187
-
188
-
189
-
190
-
191
-
192
-
193
-
194
-
195
-
196
-
197
-
198
-
199
-
200
-
201
-
202
-
203
-
204
-
205
-
206
-
207
-
208
-
209
-
210
-
211
-
212
-
213
-
214
-
215
-
216
-
217
-
218
-
219
-
220
-
221
-
222
-
223
-
224
-
225
-
226
-
227
-
228
-
229
-
230
-
231
-
232
-
233
-
234
-
235
-
236
 |
 |

131
ANNUAl REPORT
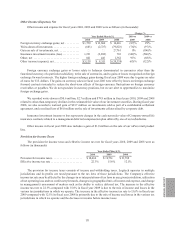
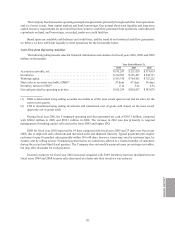
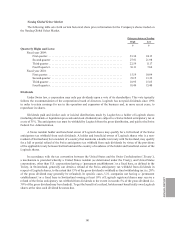
Other Income (Expense), Net
Other income and expense for fiscal years 2010, 2009 and 2008 were as follows (in thousands):
Change %
Year Ended March 31, 2010 vs 2009 vs
2010 2009 2008 2009 2008
Foreign currency exchange gains, net . . . . . . . . . . $1,720 $13,680 $10,616 (87)% 29%
Write-down of investments . . . . . . . . . . . . . . . . . . (643)(2,727)(79,823)(76)% (97)%
Gain on sale of investments, net ............... — — 27,761 0% (100)%
Insurance investment income (loss) ............ 1,221 (2,883)710 (142)% (506)%
Other, net ................................ 841 441 1,362 91%(68)%
Other income (expense), net .................. $3,139 $8,511 $(39,374)(63)% (122)%
Foreign currency exchange gains or losses relate to balances denominated in currencies other than the
functional currency of a particular subsidiary, to the sale of currencies, and to gains or losses recognized on foreign
exchange forward contracts. The higher foreign exchange gains during fiscal year 2009 were due to gains on sales
of euros for U.S. dollars. The gains on currency sales in fiscal year 2010 were offset by losses on foreign exchange
forward contracts intended to reduce the short-term effects of foreign currency fluctuations on foreign currency
receivables or payables. We do not speculate in currency positions, but we are alert to opportunities to maximize
foreign exchange gains.
We recorded write-downs of $0.6 million, $2.7 million and $79.8 million in fiscal years 2010, 2009 and 2008
related to other-than-temporary declines in the estimated fair value of our investment securities. During fiscal year
2008, we also recorded a realized gain of $33.7 million on investments sold as part of a confidential settlement
agreement, and a realized loss of $6.0 million on the sale of investments collateralized by corporate debt.
Insurance investment income or loss represents changes in the cash surrender value of Company-owned life
insurance contracts related to a management deferred compensation plan offered by one of our subsidiaries.
Other income in fiscal year 2008 also includes a gain of $1.0 million on the sale of our ioPen retail product
line.
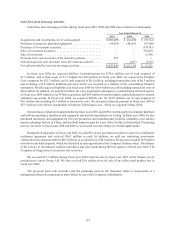
Provision for Income Taxes
The provision for income taxes and effective income tax rate for fiscal years 2010, 2009 and 2008 were as
follows (in thousands):
Year Ended March 31,
2010 2009 2008
Provision for income taxes ..................... $18,666 $19,761 $31,788
Effective income tax rate . . . . . . . . . . . . . . . . . . . . . . 22.3%15.6%12.1%
The provision for income taxes consists of income and withholding taxes. Logitech operates in multiple
jurisdictions and its profits are taxed pursuant to the tax laws of these jurisdictions. The Company’s effective
income tax rate may be affected by the changes in or interpretations of tax laws in any given jurisdiction, utilization
of net operating loss and tax credit carryforwards, changes in geographical mix of income and expense, and change
in management’s assessment of matters such as the ability to realize deferred tax. The increase in the effective
income tax rate to 22.3% compared with 15.6% in fiscal year 2009 is due to the mix of income and losses in the
various tax jurisdictions in which we operate. The increase in the effective income tax rate to 15.6% in fiscal year
2009 compared with 12.1% in fiscal year 2008 is primarily due to the mix of income and losses in the various tax
jurisdictions in which we operate and the decrease in income before income taxes.