Logitech 2010 Annual Report Download - page 210
Download and view the complete annual report
Please find page 210 of the 2010 Logitech annual report below. You can navigate through the pages in the report by either clicking on the pages listed below, or by using the keyword search tool below to find specific information within the annual report.-
 1
1 -
2
-
3
-
4
-
5
-
6
-
7
-
8
-
9
-
10
-
11
-
12
-
13
-
14
-
15
-
16
-
17
-
18
-
19
-
20
-
21
-
22
-
23
-
24
-
25
-
26
-
27
-
28
-
29
-
30
-
31
-
32
-
33
-
34
-
35
-
36
-
37
-
38
-
39
-
40
-
41
-
42
-
43
-
44
-
45
-
46
-
47
-
48
-
49
-
50
-
51
-
52
-
53
-
54
-
55
-
56
-
57
-
58
-
59
-
60
-
61
-
62
-
63
-
64
-
65
-
66
-
67
-
68
-
69
-
70
-
71
-
72
-
73
-
74
-
75
-
76
-
77
-
78
-
79
-
80
-
81
-
82
-
83
-
84
-
85
-
86
-
87
-
88
-
89
-
90
-
91
-
92
-
93
-
94
-
95
-
96
-
97
-
98
-
99
-
100
-
101
-
102
-
103
-
104
-
105
-
106
-
107
-
108
-
109
-
110
-
111
-
112
-
113
-
114
-
115
-
116
-
117
-
118
-
119
-
120
-
121
-
122
-
123
-
124
-
125
-
126
-
127
-
128
-
129
-
130
-
131
-
132
-
133
-
134
-
135
-
136
-
137
-
138
-
139
-
140
-
141
-
142
-
143
-
144
-
145
-
146
-
147
-
148
-
149
-
150
-
151
-
152
-
153
-
154
-
155
-
156
-
157
-
158
-
159
-
160
-
161
-
162
-
163
-
164
-
165
-
166
-
167
-
168
-
169
-
170
-
171
-
172
-
173
-
174
-
175
-
176
-
177
-
178
-
179
-
180
-
181
-
182
-
183
-
184
-
185
-
186
-
187
-
188
-
189
-
190
-
191
-
192
-
193
-
194
-
195
-
196
-
197
-
198
-
199
-
 200
200 -
 201
201 -
 202
202 -
 203
203 -
 204
204 -
 205
205 -
 206
206 -
 207
207 -
 208
208 -
 209
209 -
 210
210 -
 211
211 -
 212
212 -
 213
213 -
 214
214 -
 215
215 -
 216
216 -
 217
217 -
 218
218 -
 219
219 -
 220
220 -
221
-
222
-
223
-
224
-
225
-
226
-
227
-
228
-
229
-
230
-
231
-
232
-
233
-
234
-
235
-
236
 |
 |

198
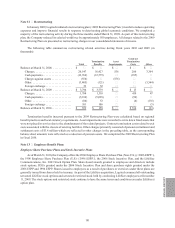
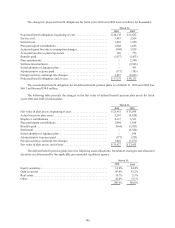
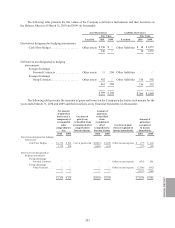
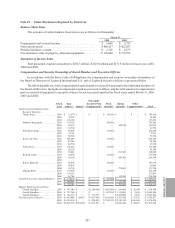
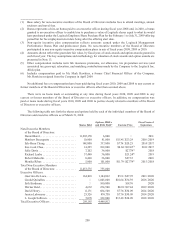
The following table presents the amounts included in accumulated other comprehensive loss as of
March 31, 2010, which are expected to be recognized as a component of net periodic benefit cost in fiscal year
2010 (in thousands):
Amortization of net transition obligation .............................................. $ 5
Amortization of net prior service costs ............................................... 142
Amortization of net actuarial loss ................................................... 362
$509
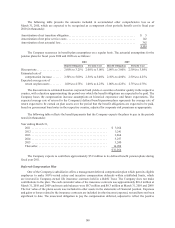
The Company reassesses its benefit plan assumptions on a regular basis. The actuarial assumptions for the
pension plans for fiscal years 2010 and 2009 are as follows:
2010 2009
Benefit Obligation Periodic Cost Benefit Obligation Periodic Cost
Discount rate ................. 2.00% to 3.25% 2.00% to 3.00% 2.00% to 3.00% 2.50% to 3.50%
Estimated rate of
compensation increase . . . . . . 2.50% to 5.00% 2.50% to 5.00% 2.50% to 4.00% 2.50% to 4.25%
Expected average rate of
return on plan assets ........ 1.00% to 4.75% 1.00% to 4.25% 1.00% to 4.25% 2.75% to 4.75%
The discount rate is estimated based on corporate bond yields or securities of similar quality in the respective
country, with a duration approximating the period over which the benefit obligations are expected to be paid. The
Company bases the compensation increase assumptions on historical experience and future expectations. The
expected average rate of return for the Company’s defined benefit pension plans represents the average rate of
return expected to be earned on plan assets over the period that the benefit obligations are expected to be paid,
based on government bond notes in the respective country, adjusted for corporate risk premiums as appropriate.
The following table reflects the benefit payments that the Company expects the plans to pay in the periods
noted (in thousands):
Year ending March 31,
2011 .................................................... $3,164
2012 .................................................... 3,241
2013 .................................................... 3,264
2014 .................................................... 3,257
2015 .................................................... 3,240
Thereafter................................................ 16,098
$32,264
The Company expects to contribute approximately $5.9 million to its defined benefit pension plans during
fiscal year 2011.
Deferred Compensation Plan
One of the Company’s subsidiaries offers a management deferred compensation plan which permits eligible
employees to make 100%-vested salary and incentive compensation deferrals within established limits, which
are invested in Company-owned life insurance contracts held in a Rabbi Trust. The Company does not make
contributions to the plan. The cash surrender value of the insurance contracts was approximately $10.4 million at
March 31, 2010 and 2009 and trust cash balances were $0.7 million and $0.3 million at March 31, 2010 and 2009.
The fair value of the plan’s assets was included in other assets in the statements of financial position. Expenses
and gains or losses related to the insurance contracts are included in other income (expense), net and have not been
significant to date. The unsecured obligation to pay the compensation deferred, adjusted to reflect the positive