Logitech 2010 Annual Report Download - page 145
Download and view the complete annual report
Please find page 145 of the 2010 Logitech annual report below. You can navigate through the pages in the report by either clicking on the pages listed below, or by using the keyword search tool below to find specific information within the annual report.-
 1
1 -
2
-
3
-
4
-
5
-
6
-
7
-
8
-
9
-
10
-
11
-
12
-
13
-
14
-
15
-
16
-
17
-
18
-
19
-
20
-
21
-
22
-
23
-
24
-
25
-
26
-
27
-
28
-
29
-
30
-
31
-
32
-
33
-
34
-
35
-
36
-
37
-
38
-
39
-
40
-
41
-
42
-
43
-
44
-
45
-
46
-
47
-
48
-
49
-
50
-
51
-
52
-
53
-
54
-
55
-
56
-
57
-
58
-
59
-
60
-
61
-
62
-
63
-
64
-
65
-
66
-
67
-
68
-
69
-
70
-
71
-
72
-
73
-
74
-
75
-
76
-
77
-
78
-
79
-
80
-
81
-
82
-
83
-
84
-
85
-
86
-
87
-
88
-
89
-
90
-
91
-
92
-
93
-
94
-
95
-
96
-
97
-
98
-
99
-
100
-
101
-
102
-
103
-
104
-
105
-
106
-
107
-
108
-
109
-
110
-
111
-
112
-
113
-
114
-
115
-
116
-
117
-
118
-
119
-
120
-
121
-
122
-
123
-
124
-
125
-
126
-
127
-
128
-
129
-
130
-
131
-
132
-
133
-
134
-
 135
135 -
 136
136 -
 137
137 -
 138
138 -
 139
139 -
 140
140 -
 141
141 -
 142
142 -
 143
143 -
 144
144 -
 145
145 -
 146
146 -
 147
147 -
 148
148 -
 149
149 -
 150
150 -
 151
151 -
 152
152 -
 153
153 -
 154
154 -
 155
155 -
156
-
157
-
158
-
159
-
160
-
161
-
162
-
163
-
164
-
165
-
166
-
167
-
168
-
169
-
170
-
171
-
172
-
173
-
174
-
175
-
176
-
177
-
178
-
179
-
180
-
181
-
182
-
183
-
184
-
185
-
186
-
187
-
188
-
189
-
190
-
191
-
192
-
193
-
194
-
195
-
196
-
197
-
198
-
199
-
200
-
201
-
202
-
203
-
204
-
205
-
206
-
207
-
208
-
209
-
210
-
211
-
212
-
213
-
214
-
215
-
216
-
217
-
218
-
219
-
220
-
221
-
222
-
223
-
224
-
225
-
226
-
227
-
228
-
229
-
230
-
231
-
232
-
233
-
234
-
235
-
236
 |
 |

133
ANNUAl REPORT
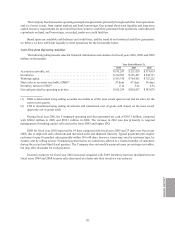
The Company has financed its operating and capital requirements primarily through cash flow from operations
and, to a lesser extent, from capital markets and bank borrowings. Our normal short-term liquidity and long-term
capital resource requirements are provided from three sources: cash flow generated from operations, cash and cash
equivalents on hand, and borrowings, as needed, under our credit facilities.
Based upon our available cash balances and credit lines, and the trend of our historical cash flow generation,
we believe we have sufficient liquidity to fund operations for the foreseeable future.
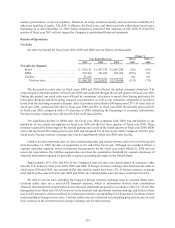
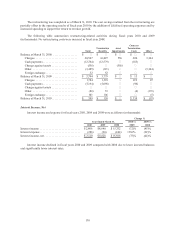
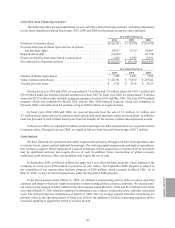
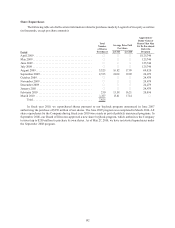
Cash Flow from Operating Activities
The following table presents selected financial information and statistics for fiscal years 2010, 2009 and 2008
(dollars in thousands):
Year Ended March 31,
2010 2009 2008
Accounts receivable, net ......................................... $195,247 $213,929 $373,619
Inventories ................................................... $219,593 $233,467 $245,737
Working capital ................................................ $353,370 $709,382 $723,221
Days sales in accounts receivable (DSO)(1). . . . . . . . . . . . . . . . . . . . . . . . . . . 33 days 47 days 56 days
Inventory turnover (ITO)(2) ....................................... 6.1x 5.2x 6.3x
Net cash provided by operating activities . . . . . . . . . . . . . . . . . . . . . . . . . . . $365,259 $200,587 $393,079
(1) DSO is determined using ending accounts receivable as of the most recent quarter-end and net sales for the
most recent quarter.
(2) ITO is determined using ending inventories and annualized cost of goods sold (based on the most recent
quarterly cost of goods sold).
During fiscal year 2010, the Company’s operating activities generated net cash of $365.3 million, compared
with $200.6 million in 2009 and $393.1 million in 2008. The increase in 2010 was due primarily to targeted
management of working capital, reflected in the lower DSO and higher ITO.
DSO for fiscal year 2010 improved by 14 days compared with fiscal year 2009 and 23 days over fiscal year
2008, due to improved cash collections and increased order and shipment linearity. Typical payment terms require
customers to pay for product sales generally within 30 to 60 days; however, terms may vary by customer type, by
country and by selling season. Extended payment terms are sometimes offered to a limited number of customers
during the second and third fiscal quarters. The Company does not modify payment terms on existing receivables,
but may offer discounts for early payment.
Inventory turnover for fiscal year 2010 increased compared with 2009. Inventory turnover declined between
fiscal years 2009 and 2008 because sales decreased at a faster rate than inventory was reduced.