Logitech 2010 Annual Report Download - page 208
Download and view the complete annual report
Please find page 208 of the 2010 Logitech annual report below. You can navigate through the pages in the report by either clicking on the pages listed below, or by using the keyword search tool below to find specific information within the annual report.-
 1
1 -
2
-
3
-
4
-
5
-
6
-
7
-
8
-
9
-
10
-
11
-
12
-
13
-
14
-
15
-
16
-
17
-
18
-
19
-
20
-
21
-
22
-
23
-
24
-
25
-
26
-
27
-
28
-
29
-
30
-
31
-
32
-
33
-
34
-
35
-
36
-
37
-
38
-
39
-
40
-
41
-
42
-
43
-
44
-
45
-
46
-
47
-
48
-
49
-
50
-
51
-
52
-
53
-
54
-
55
-
56
-
57
-
58
-
59
-
60
-
61
-
62
-
63
-
64
-
65
-
66
-
67
-
68
-
69
-
70
-
71
-
72
-
73
-
74
-
75
-
76
-
77
-
78
-
79
-
80
-
81
-
82
-
83
-
84
-
85
-
86
-
87
-
88
-
89
-
90
-
91
-
92
-
93
-
94
-
95
-
96
-
97
-
98
-
99
-
100
-
101
-
102
-
103
-
104
-
105
-
106
-
107
-
108
-
109
-
110
-
111
-
112
-
113
-
114
-
115
-
116
-
117
-
118
-
119
-
120
-
121
-
122
-
123
-
124
-
125
-
126
-
127
-
128
-
129
-
130
-
131
-
132
-
133
-
134
-
135
-
136
-
137
-
138
-
139
-
140
-
141
-
142
-
143
-
144
-
145
-
146
-
147
-
148
-
149
-
150
-
151
-
152
-
153
-
154
-
155
-
156
-
157
-
158
-
159
-
160
-
161
-
162
-
163
-
164
-
165
-
166
-
167
-
168
-
169
-
170
-
171
-
172
-
173
-
174
-
175
-
176
-
177
-
178
-
179
-
180
-
181
-
182
-
183
-
184
-
185
-
186
-
187
-
188
-
189
-
190
-
191
-
192
-
193
-
194
-
195
-
196
-
197
-
 198
198 -
 199
199 -
 200
200 -
 201
201 -
 202
202 -
 203
203 -
 204
204 -
 205
205 -
 206
206 -
 207
207 -
 208
208 -
 209
209 -
 210
210 -
 211
211 -
 212
212 -
 213
213 -
 214
214 -
 215
215 -
 216
216 -
 217
217 -
 218
218 -
219
-
220
-
221
-
222
-
223
-
224
-
225
-
226
-
227
-
228
-
229
-
230
-
231
-
232
-
233
-
234
-
235
-
236
 |
 |

196
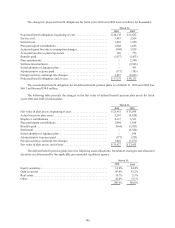
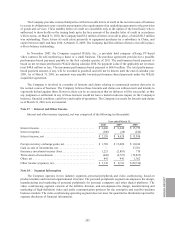
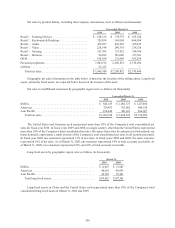
The changes in projected benefit obligations for fiscal years 2010 and 2009 were as follows (in thousands):
March 31,
2010 2009
Projected benefit obligation, beginning of year ...................... $48,135 $51,632
Service cost .................................................. 3,983 2,814
Interest cost .................................................. 1,430 1,520
Plan participant contributions. . . . . . . . . . . . . . . . . . . . . . . . . . . . . . . . . . . . 1,848 1,656
Actuarial (gain) loss due to assumption changes ..................... (994)3,828
Actuarial loss due to plan experience .............................. 916 776
Benefits paid ................................................. (1,037)(1,413)
Plan amendments ............................................. — 2,590
Settlement/curtailment ......................................... —(9,503)
Initial adoption of Japanese plan . . . . . . . . . . . . . . . . . . . . . . . . . . . . . . . . . — 431
Administrative expense paid .................................... (177) (183)
Foreign currency exchange rate changes . . . . . . . . . . . . . . . . . . . . . . . . . . . 3,427 (6,013)
Projected benefit obligation, end of year . . . . . . . . . . . . . . . . . . . . . . . . . . . $ 57,531 $48,135
The accumulated benefit obligation for all defined benefit pension plans as of March 31, 2010 and 2009 was
$46.3 million and $39.0 million.
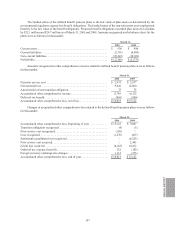
The following table presents the changes in the fair value of defined benefit pension plan assets for fiscal
years 2010 and 2009 (in thousands):
March 31,
2010 2009
Fair value of plan assets, beginning of year ......................... $23,415 $35,059
Actual return on plan assets ..................................... 5,267 (4,928)
Employer contributions ........................................ 4,137 3,531
Plan participant contributions. . . . . . . . . . . . . . . . . . . . . . . . . . . . . . . . . . . . 1,848 1,656
Benefits paid ................................................. (864)(1,413)
Settlement ................................................... —(6,580)
Initial adoption of Japanese plan . . . . . . . . . . . . . . . . . . . . . . . . . . . . . . . . . — 244
Administrative expenses paid ................................... (177)(183)
Foreign currency exchange rate changes . . . . . . . . . . . . . . . . . . . . . . . . . . . 1,801 (3,971)
Fair value of plan assets, end of year . . . . . . . . . . . . . . . . . . . . . . . . . . . . . . $ 35,427 $23,415
The defined benefit pension plans have the following asset allocations. Investment strategies and allocation
decisions are determined by the applicable governmental regulatory agency.
March 31,
2010 2009
Equity securities .............................................. 34.8%24.4%
Debt securities ............................................... 43.6%53.2%
Real estate ................................................... 10.7%5.3%
Other ....................................................... 10.9%17.1%
100.0%100.0%