Logitech 2010 Annual Report Download - page 192
Download and view the complete annual report
Please find page 192 of the 2010 Logitech annual report below. You can navigate through the pages in the report by either clicking on the pages listed below, or by using the keyword search tool below to find specific information within the annual report.-
 1
1 -
2
-
3
-
4
-
5
-
6
-
7
-
8
-
9
-
10
-
11
-
12
-
13
-
14
-
15
-
16
-
17
-
18
-
19
-
20
-
21
-
22
-
23
-
24
-
25
-
26
-
27
-
28
-
29
-
30
-
31
-
32
-
33
-
34
-
35
-
36
-
37
-
38
-
39
-
40
-
41
-
42
-
43
-
44
-
45
-
46
-
47
-
48
-
49
-
50
-
51
-
52
-
53
-
54
-
55
-
56
-
57
-
58
-
59
-
60
-
61
-
62
-
63
-
64
-
65
-
66
-
67
-
68
-
69
-
70
-
71
-
72
-
73
-
74
-
75
-
76
-
77
-
78
-
79
-
80
-
81
-
82
-
83
-
84
-
85
-
86
-
87
-
88
-
89
-
90
-
91
-
92
-
93
-
94
-
95
-
96
-
97
-
98
-
99
-
100
-
101
-
102
-
103
-
104
-
105
-
106
-
107
-
108
-
109
-
110
-
111
-
112
-
113
-
114
-
115
-
116
-
117
-
118
-
119
-
120
-
121
-
122
-
123
-
124
-
125
-
126
-
127
-
128
-
129
-
130
-
131
-
132
-
133
-
134
-
135
-
136
-
137
-
138
-
139
-
140
-
141
-
142
-
143
-
144
-
145
-
146
-
147
-
148
-
149
-
150
-
151
-
152
-
153
-
154
-
155
-
156
-
157
-
158
-
159
-
160
-
161
-
162
-
163
-
164
-
165
-
166
-
167
-
168
-
169
-
170
-
171
-
172
-
173
-
174
-
175
-
176
-
177
-
178
-
179
-
180
-
181
-
 182
182 -
 183
183 -
 184
184 -
 185
185 -
 186
186 -
 187
187 -
 188
188 -
 189
189 -
 190
190 -
 191
191 -
 192
192 -
 193
193 -
 194
194 -
 195
195 -
 196
196 -
 197
197 -
 198
198 -
 199
199 -
 200
200 -
 201
201 -
 202
202 -
203
-
204
-
205
-
206
-
207
-
208
-
209
-
210
-
211
-
212
-
213
-
214
-
215
-
216
-
217
-
218
-
219
-
220
-
221
-
222
-
223
-
224
-
225
-
226
-
227
-
228
-
229
-
230
-
231
-
232
-
233
-
234
-
235
-
236
 |
 |

180
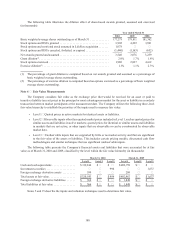
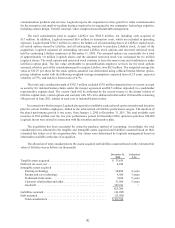
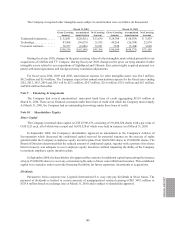
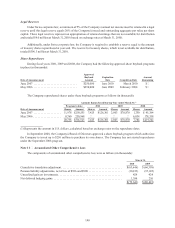
The following table illustrates the dilution effect of share-based awards granted, assumed and exercised
(in thousands):
Year ended March 31
2010 2009 2008
Basic weighted average shares outstanding as of March 31 . . . . . . . . . . . . . 177,279 178,811 181,362
Stock options and RSUs granted . . . . . . . . . . . . . . . . . . . . . . . . . . . . . . . . . . 3,902 4,239 3,891
Stock options and restricted stock assumed in LifeSize acquisition ....... 1,078 — —
Stock options and RSUs canceled, forfeited, or expired . . . . . . . . . . . . . . . . (1,440)(1,163)(652)
Net awards granted and assumed .................................. 3,540 3,076 3,239
Grant dilution(1) ................................................ 2.0%1.7%1.8%
Stock options exercised ......................................... 1,980 2,037 4,162
Exercise dilution(2). . . . . . . . . . . . . . . . . . . . . . . . . . . . . . . . . . . . . . . . . . . . . . 1.1%1.1%2.3%
(1) The percentage of grant dilution is computed based on net awards granted and assumed as a percentage of
basic weighted average shares outstanding.
(2) The percentage of exercise dilution is computed based on options exercised as a percentage of basic weighted
average shares outstanding.
Note 4 — Fair Value Measurements
The Company considers fair value as the exchange price that would be received for an asset or paid to
transfer a liability (an exit price) in the principal or most advantageous market for the asset or liability in an orderly
transaction between market participants at the measurement date. The Company utilizes the following three-level
fair value hierarchy to establish the priorities of the inputs used to measure fair value:
• Level 1 – Quoted prices in active markets for identical assets or liabilities.
• Level 2 – Observable inputs other than quoted market prices included in Level 1, such as quoted prices for
similar assets and liabilities in active markets; quoted prices for identical or similar assets and liabilities
in markets that are not active; or other inputs that are observable or can be corroborated by observable
market data.
• Level 3 – Unobservable inputs that are supported by little or no market activity and that are significant
to the fair value of the assets or liabilities. This includes certain pricing models, discounted cash flow
methodologies and similar techniques that use significant unobservable inputs.
The following table presents the Company’s financial assets and liabilities that were accounted for at fair
value as of March 31, 2010 and 2009, classified by the level within the fair value hierarchy (in thousands):
March 31, 2010 March 31, 2009
Level 1 Level 2 Level 3 Level 1 Level 2 Level 3
Cash and cash equivalents . . . . . . . . . . . . . . . . $ 319,944 $ — $ — $492,759 $ — $ —
Investment securities . . . . . . . . . . . . . . . . . . . . — — 994 — — 1,637
Foreign exchange derivative assets . . . . . . . . . 599 — — 208 — —
Total assets at fair value . . . . . . . . . . . . . . . . . . $320,543 $ — $ 994 $492,967 $ — $1,637
Foreign exchange derivative liabilities ....... $366 $ — $ — $ 1,849 $ — $ —
Total liabilities at fair value . . . . . . . . . . . . . . . $ 366 $ — $ — $ 1,849 $ — $ —
Notes 5 and 15 describe the inputs and valuation techniques used to determine fair value.