Logitech 2010 Annual Report Download - page 156
Download and view the complete annual report
Please find page 156 of the 2010 Logitech annual report below. You can navigate through the pages in the report by either clicking on the pages listed below, or by using the keyword search tool below to find specific information within the annual report.-
 1
1 -
2
-
3
-
4
-
5
-
6
-
7
-
8
-
9
-
10
-
11
-
12
-
13
-
14
-
15
-
16
-
17
-
18
-
19
-
20
-
21
-
22
-
23
-
24
-
25
-
26
-
27
-
28
-
29
-
30
-
31
-
32
-
33
-
34
-
35
-
36
-
37
-
38
-
39
-
40
-
41
-
42
-
43
-
44
-
45
-
46
-
47
-
48
-
49
-
50
-
51
-
52
-
53
-
54
-
55
-
56
-
57
-
58
-
59
-
60
-
61
-
62
-
63
-
64
-
65
-
66
-
67
-
68
-
69
-
70
-
71
-
72
-
73
-
74
-
75
-
76
-
77
-
78
-
79
-
80
-
81
-
82
-
83
-
84
-
85
-
86
-
87
-
88
-
89
-
90
-
91
-
92
-
93
-
94
-
95
-
96
-
97
-
98
-
99
-
100
-
101
-
102
-
103
-
104
-
105
-
106
-
107
-
108
-
109
-
110
-
111
-
112
-
113
-
114
-
115
-
116
-
117
-
118
-
119
-
120
-
121
-
122
-
123
-
124
-
125
-
126
-
127
-
128
-
129
-
130
-
131
-
132
-
133
-
134
-
135
-
136
-
137
-
138
-
139
-
140
-
141
-
142
-
143
-
144
-
145
-
 146
146 -
 147
147 -
 148
148 -
 149
149 -
 150
150 -
 151
151 -
 152
152 -
 153
153 -
 154
154 -
 155
155 -
 156
156 -
 157
157 -
 158
158 -
 159
159 -
 160
160 -
 161
161 -
 162
162 -
 163
163 -
 164
164 -
 165
165 -
 166
166 -
167
-
168
-
169
-
170
-
171
-
172
-
173
-
174
-
175
-
176
-
177
-
178
-
179
-
180
-
181
-
182
-
183
-
184
-
185
-
186
-
187
-
188
-
189
-
190
-
191
-
192
-
193
-
194
-
195
-
196
-
197
-
198
-
199
-
200
-
201
-
202
-
203
-
204
-
205
-
206
-
207
-
208
-
209
-
210
-
211
-
212
-
213
-
214
-
215
-
216
-
217
-
218
-
219
-
220
-
221
-
222
-
223
-
224
-
225
-
226
-
227
-
228
-
229
-
230
-
231
-
232
-
233
-
234
-
235
-
236
 |
 |

144
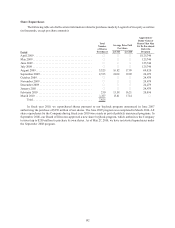
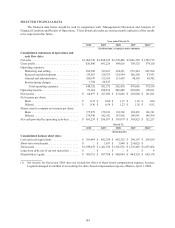
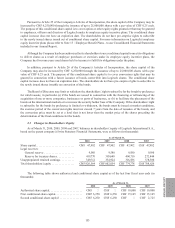
SELECTED FINANCIAL DATA
The financial data below should be read in conjunction with “Management’s Discussion and Analysis of
Financial Condition and Results of Operations.” These historical results are not necessarily indicative of the results
to be expected in the future.
Year ended March 31,
2010 2009 2008 2007 2006(1)
(In thousands, except per share amounts)
Consolidated statements of operations and
cash flow data:
Net sales ................................ $1,966,748 $2,208,832 $2,370,496 $2,066,569 $1,796,715
Gross profit .............................. 626,896 691,226 849,118 709,525 574,110
Operating expenses:
Marketing and selling ................... 304,788 319,167 324,451 272,264 221,504
Research and development . . . . . . . . . . . . . . . 135,813 128,755 124,544 108,256 87,953
General and administrative ............... 106,147 113,103 113,443 98,143 65,742
Restructuring charges ................... 1,784 20,547 — — —
Total operating expenses .............. 548,532 581,572 562,438 478,663 375,199
Operating income ......................... 78,364 109,654 286,680 230,862 198,911
Net income .............................. $ 64,957 $107,032 $231,026 $229,848 $181,105
Net income per share:
Basic ................................ $ 0.37 $0.60 $1.27 $1.26 $1.00
Diluted ............................... $0.36 $0.59 $1.23 $1.20 $0.92
Shares used to compute net income per share:
Basic ................................ 177,279 178,811 181,362 182,635 181,361
Diluted ............................... 179,340 182,911 187,942 190,991 198,769
Net cash provided by operating activities . . . . . . $ 365,259 $200,587 $393,079 $303,825 $152,217
March 31,
2010 2009 2008 2007 2006(1)
(In thousands)
Consolidated balance sheet data:
Cash and cash equivalents . . . . . . . . . . . . . . . . . . $ 319,944 $492,759 $482,352 $196,197 $245,014
Short-term investments. . . . . . . . . . . . . . . . . . . . . $ — $ 1,637 $3,940 $214,625 $ —
Total assets .............................. $1,599,678 $1,421,530 $1,526,932 $1,327,463 $1,057,064
Long-term debt, net of current maturities . . . . . . $ — $ — $ — $ — $ 4
Shareholders’ equity ....................... $999,715 $997,708 $960,044 $844,524 $685,176
(1) Net income for fiscal year 2006 does not include the effect of share-based compensation expense, because
Logitech changed its method of accounting for share-based compensation expense effective April 1, 2006.