Logitech 2010 Annual Report Download - page 141
Download and view the complete annual report
Please find page 141 of the 2010 Logitech annual report below. You can navigate through the pages in the report by either clicking on the pages listed below, or by using the keyword search tool below to find specific information within the annual report.-
 1
1 -
2
-
3
-
4
-
5
-
6
-
7
-
8
-
9
-
10
-
11
-
12
-
13
-
14
-
15
-
16
-
17
-
18
-
19
-
20
-
21
-
22
-
23
-
24
-
25
-
26
-
27
-
28
-
29
-
30
-
31
-
32
-
33
-
34
-
35
-
36
-
37
-
38
-
39
-
40
-
41
-
42
-
43
-
44
-
45
-
46
-
47
-
48
-
49
-
50
-
51
-
52
-
53
-
54
-
55
-
56
-
57
-
58
-
59
-
60
-
61
-
62
-
63
-
64
-
65
-
66
-
67
-
68
-
69
-
70
-
71
-
72
-
73
-
74
-
75
-
76
-
77
-
78
-
79
-
80
-
81
-
82
-
83
-
84
-
85
-
86
-
87
-
88
-
89
-
90
-
91
-
92
-
93
-
94
-
95
-
96
-
97
-
98
-
99
-
100
-
101
-
102
-
103
-
104
-
105
-
106
-
107
-
108
-
109
-
110
-
111
-
112
-
113
-
114
-
115
-
116
-
117
-
118
-
119
-
120
-
121
-
122
-
123
-
124
-
125
-
126
-
127
-
128
-
129
-
130
-
 131
131 -
 132
132 -
 133
133 -
 134
134 -
 135
135 -
 136
136 -
 137
137 -
 138
138 -
 139
139 -
 140
140 -
 141
141 -
 142
142 -
 143
143 -
 144
144 -
 145
145 -
 146
146 -
 147
147 -
 148
148 -
 149
149 -
 150
150 -
 151
151 -
152
-
153
-
154
-
155
-
156
-
157
-
158
-
159
-
160
-
161
-
162
-
163
-
164
-
165
-
166
-
167
-
168
-
169
-
170
-
171
-
172
-
173
-
174
-
175
-
176
-
177
-
178
-
179
-
180
-
181
-
182
-
183
-
184
-
185
-
186
-
187
-
188
-
189
-
190
-
191
-
192
-
193
-
194
-
195
-
196
-
197
-
198
-
199
-
200
-
201
-
202
-
203
-
204
-
205
-
206
-
207
-
208
-
209
-
210
-
211
-
212
-
213
-
214
-
215
-
216
-
217
-
218
-
219
-
220
-
221
-
222
-
223
-
224
-
225
-
226
-
227
-
228
-
229
-
230
-
231
-
232
-
233
-
234
-
235
-
236
 |
 |

129
ANNUAl REPORT
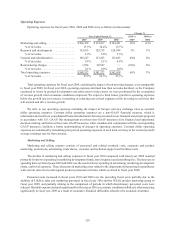
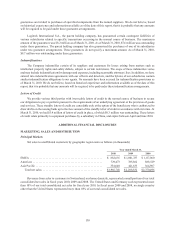
If foreign currency exchange rates had been the same in fiscal years 2010 and 2009, the percentage decrease
in constant dollar marketing and selling expense for fiscal year 2010 would not have changed. The impact of year-
over-year exchange rate changes on translation of foreign currency marketing and selling expenses to our U.S.
dollar financial statements was not material in fiscal year 2009 compared with fiscal year 2008.
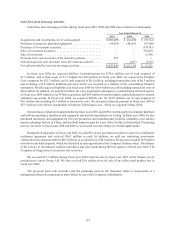
Research and Development
Research and development expense consists of personnel and related overhead costs, contractors and outside
consultants, supplies and materials, equipment depreciation and facilities costs, all associated with the design and
development of new products and enhancements of existing products.
The increases in research and development expenses in fiscal years 2010 and 2009 resulted from the addition
of research and development costs of companies acquired in fiscal years 2010, 2009 and 2008. Personnel costs were
approximately the same in fiscal years 2009 and 2008, but increased in fiscal year 2010 in comparison with fiscal
year 2009, when discretionary personnel costs were reduced.
If foreign currency exchange rates had been the same in fiscal years 2010 and 2009, the change in constant
dollar research and development expense would have been 5%, the same as the change in U.S. dollars. In fiscal year
2009, exchange rate changes, particularly from the stronger Swiss franc and Taiwanese dollar relative to the U.S.
dollar, contributed to the increase in research and development expense.
General and Administrative
General and administrative expense consists primarily of personnel and related overhead and facilities costs
for the finance, information systems, executive, human resources and legal functions.
General and administrative expense was approximately the same in fiscal years 2009 and 2008, and declined
in fiscal year 2010. The decline in fiscal year 2010 was primarily due to a decrease of 5% in personnel costs, as
headcount was reduced, although the headcount reduction was offset by the addition of LifeSize personnel in the
fourth fiscal quarter. Personnel costs increased 2% during fiscal year 2009 primarily due to an increase in share-
based compensation expense. Decreases in travel and infrastructure expenses in fiscal year 2010 were partially
offset by $6.6 million in transaction costs related to the acquisition of LifeSize. Consulting fees and travel expenses
decreased in fiscal year 2009 compared with fiscal year 2008 as a result of cost containment efforts.
If foreign currency exchange rates had been the same in fiscal years 2010 and 2009, the percentage decrease
in constant dollar general and administrative expense for fiscal year 2010 would have been 7%. Exchange rate
changes, particularly from the stronger Swiss franc relative to the U.S. dollar, contributed to the increase in general
and administrative expense in fiscal year 2009.
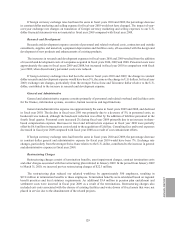
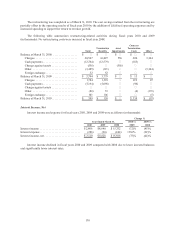
Restructuring Charges
Restructuring charges consist of termination benefits, asset impairment charges, contract termination costs
and other charges associated with the restructuring plan initiated in January 2009. In the period from January 2009
to March 31, 2010, we incurred pre-tax restructuring charges of $22.3 million.
The restructuring plan reduced our salaried workforce by approximately 500 employees, resulting in
$17.8 million in termination benefits to those employees. Termination benefits were calculated based on regional
benefit practices and local statutory requirements. An additional $3.4 million in pension plan curtailment and
settlement costs were incurred in fiscal year 2009 as a result of the terminations. Restructuring charges also
included exit costs associated with the closure of existing facilities and write downs of fixed assets that were not
placed in service due to the abandonment of the related projects.