Logitech 2010 Annual Report Download - page 193
Download and view the complete annual report
Please find page 193 of the 2010 Logitech annual report below. You can navigate through the pages in the report by either clicking on the pages listed below, or by using the keyword search tool below to find specific information within the annual report.-
 1
1 -
2
-
3
-
4
-
5
-
6
-
7
-
8
-
9
-
10
-
11
-
12
-
13
-
14
-
15
-
16
-
17
-
18
-
19
-
20
-
21
-
22
-
23
-
24
-
25
-
26
-
27
-
28
-
29
-
30
-
31
-
32
-
33
-
34
-
35
-
36
-
37
-
38
-
39
-
40
-
41
-
42
-
43
-
44
-
45
-
46
-
47
-
48
-
49
-
50
-
51
-
52
-
53
-
54
-
55
-
56
-
57
-
58
-
59
-
60
-
61
-
62
-
63
-
64
-
65
-
66
-
67
-
68
-
69
-
70
-
71
-
72
-
73
-
74
-
75
-
76
-
77
-
78
-
79
-
80
-
81
-
82
-
83
-
84
-
85
-
86
-
87
-
88
-
89
-
90
-
91
-
92
-
93
-
94
-
95
-
96
-
97
-
98
-
99
-
100
-
101
-
102
-
103
-
104
-
105
-
106
-
107
-
108
-
109
-
110
-
111
-
112
-
113
-
114
-
115
-
116
-
117
-
118
-
119
-
120
-
121
-
122
-
123
-
124
-
125
-
126
-
127
-
128
-
129
-
130
-
131
-
132
-
133
-
134
-
135
-
136
-
137
-
138
-
139
-
140
-
141
-
142
-
143
-
144
-
145
-
146
-
147
-
148
-
149
-
150
-
151
-
152
-
153
-
154
-
155
-
156
-
157
-
158
-
159
-
160
-
161
-
162
-
163
-
164
-
165
-
166
-
167
-
168
-
169
-
170
-
171
-
172
-
173
-
174
-
175
-
176
-
177
-
178
-
179
-
180
-
181
-
182
-
 183
183 -
 184
184 -
 185
185 -
 186
186 -
 187
187 -
 188
188 -
 189
189 -
 190
190 -
 191
191 -
 192
192 -
 193
193 -
 194
194 -
 195
195 -
 196
196 -
 197
197 -
 198
198 -
 199
199 -
 200
200 -
 201
201 -
 202
202 -
 203
203 -
204
-
205
-
206
-
207
-
208
-
209
-
210
-
211
-
212
-
213
-
214
-
215
-
216
-
217
-
218
-
219
-
220
-
221
-
222
-
223
-
224
-
225
-
226
-
227
-
228
-
229
-
230
-
231
-
232
-
233
-
234
-
235
-
236
 |
 |

ANNUAl REPORT
181
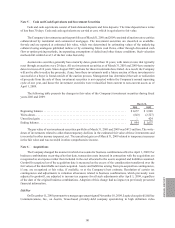
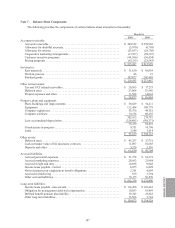
Note 5 — Cash and Cash Equivalents and Investment Securities
Cash and cash equivalents consist of bank demand deposits and time deposits. The time deposits have terms
of less than 30 days. Cash and cash equivalents are carried at cost, which is equivalent to fair value.
The Company’s investment securities portfolio as of March 31, 2010 and 2009 consisted of auction rate securities
collateralized by residential and commercial mortgages. The investment securities are classified as available-
for-sale and are reported at estimated fair value, which was determined by estimating values of the underlying
collateral using analogous published indices or by estimating future cash flows, either through discounted cash
flow or option pricing methods, incorporating assumptions of default and other future conditions. Such valuation
methods fall within Level 3 of the fair value hierarchy.
Auction rate securities generally have maturity dates greater than 10 years, with interest rates that typically
reset through an auction every 28 days. All our investment securities as of March 31, 2010 and 2009 have maturity
dates in excess of 10 years. Since August 2007, auctions for these investments have failed. As a result, the Company
will not be able to realize the proceeds, if any, from these investments until a future auction of these investments is
successful or a buyer is found outside of the auction process. Management has determined that sale or realization
of proceeds from the sale of these investment securities is not expected within the Company’s normal operating
cycle of one year, and hence the investment securities were reclassified from current to non-current assets as of
April 1, 2009.
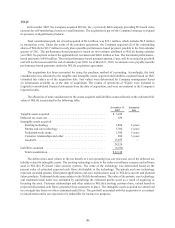
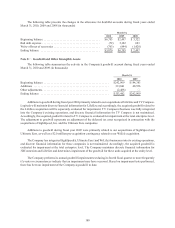
The following table presents the changes in fair value of the Company’s investment securities during fiscal
years 2010 and 2009:
March 31,
2010 2009
Beginning balance ......................................................... $1,637 $3,940
Write-down ............................................................... (643)(2,727)
Unrealized gain ............................................................ —424
Ending balance ............................................................ $994 $1,637
The par value of our investment securities portfolio at March 31, 2010 and 2009 was $47.5 million. The write-
down of investments related to other-than-temporary declines in the estimated fair value of these investments and
is recorded in other income (expense), net. The unrealized gain as of March 31, 2009 related to temporary increases
in the fair value and was recorded in other comprehensive income.
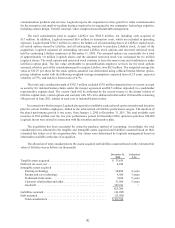
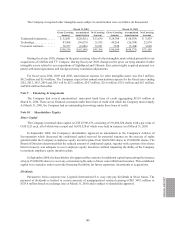
Note 6 — Acquisitions
The Company changed the manner in which it accounts for business combinations effective April 1, 2009. For
business combinations occurring after that date, transaction costs incurred in connection with the acquisition are
recognized as an expense rather than included in the cost allocated to the assets acquired and liabilities assumed.
Goodwill recognized as of the acquisition date is measured as the excess of the consideration transferred over the
fair values of the identifiable net assets acquired. Assets and liabilities arising from pre-acquisition contingencies,
if any, are recognized at fair value, if available, or at the Company’s best estimate. Resolution of certain tax
contingencies and adjustments to valuation allowances related to business combinations, which previously were
adjusted to goodwill, are adjusted to income tax expense for all such adjustments after April 1, 2009, regardless
of the date of the original business combinations. Adoption of this change had no impact on previously presented
financial information.
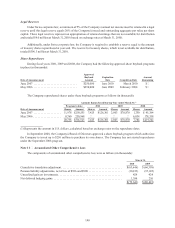
LifeSize
On December 11, 2009, pursuant to a merger agreement signed November 10, 2009, Logitech acquired LifeSize
Communications, Inc., an Austin, Texas-based privately-held company specializing in high definition video