Foot Locker 2008 Annual Report Download - page 70
Download and view the complete annual report
Please find page 70 of the 2008 Foot Locker annual report below. You can navigate through the pages in the report by either clicking on the pages listed below, or by using the keyword search tool below to find specific information within the annual report.-
 1
1 -
2
-
3
-
4
-
5
-
6
-
7
-
8
-
9
-
10
-
11
-
12
-
13
-
14
-
15
-
16
-
17
-
18
-
19
-
20
-
21
-
22
-
23
-
24
-
25
-
26
-
27
-
28
-
29
-
30
-
31
-
32
-
33
-
34
-
35
-
36
-
37
-
38
-
39
-
40
-
41
-
42
-
43
-
44
-
45
-
46
-
47
-
48
-
49
-
50
-
51
-
52
-
53
-
54
-
55
-
56
-
57
-
58
-
59
-
 60
60 -
 61
61 -
 62
62 -
 63
63 -
 64
64 -
 65
65 -
 66
66 -
 67
67 -
 68
68 -
 69
69 -
 70
70 -
 71
71 -
 72
72 -
 73
73 -
 74
74 -
 75
75 -
 76
76 -
 77
77 -
 78
78 -
 79
79 -
 80
80 -
81
-
82
-
83
-
84
-
85
-
86
-
87
-
88
-
89
-
90
-
91
-
92
-
93
-
94
-
95
-
96
-
97
-
98
-
99
 |
 |

54
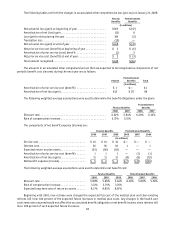
During 2008, the Company entered into a series of monthly diesel fuel forward contracts to mitigate a portion
of the Company’s freight expense due to the variability caused by fuel surcharges imposed by our third-party freight
carriers. The notional value of the contracts outstanding as of January 31, 2009 was $2 million and these contracts
extend through November 2009. Changes in the fair value of these contracts are recorded in earnings immediately. The
effect was not significant for the year ended January 31, 2009.
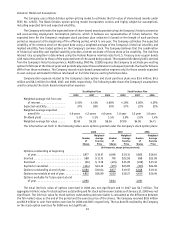
Foreign Currency Exchange Rates
The table below presents the fair value, notional amounts, and weighted-average exchange rates of foreign
exchange forward and option contracts outstanding at January 31, 2009.
Fair Value
(U.S. in millions)
Contract Value
(U.S. in millions)
Weighted-Average
Exchange Rate
Inventory
Buy €/Sell British £ .................................. $ 3 $33 0.8296
Buy US/Sell € ...................................... — 9 0.7424
Intercompany
Buy US/Sell € ...................................... $— $ 4 0.7092
Buy €/Sell British £ .................................. 1 17 0.8311
Buy €/Sell SEK ..................................... — 1 10.6350
Buy US/Sell CAD$ ................................... — 4 1.2161
Interest Rate Risk Management
The Company has employed various interest rate swaps to minimize its exposure to interest rate fluctuations.
These swaps have been designated as a fair value hedge of the changes in fair value of $100 million of the Company’s
8.50 percent debentures payable in 2022 attributable to changes in interest rates and effectively converted the
interest rate on the debentures from 8.50 percent to a 1-month variable rate of LIBOR plus 3.45 percent. On March 20,
2009, the Company terminated its interest rate swaps for a gain of approximately $20 million. This gain will be amortized
as part of interest expense over the remaining term of the debt using the effective-yield method.
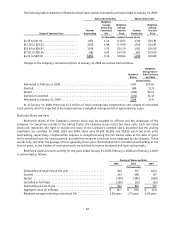
The following table presents the Company’s interest rate derivatives outstanding as of each of the respective
years:
2008 2007 2006
(in millions)
Interest Rate Swaps:
Fixed to Variable ($US) — notional amount ............................ $ 100 $ 100 $ 100
Average pay rate . . . . . . . . . . . . . . . . . . . . . . . . . . . . . . . . . . . . . . . . . . . . . . 4.87% 6.22% 8.53%
Average receive rate ........................................... 8.50% 8.50% 8.50%
Variable to variable ($US) — notional amount .......................... $ 100 $ 100 $ 100
Average pay rate . . . . . . . . . . . . . . . . . . . . . . . . . . . . . . . . . . . . . . . . . . . . . . 0.67% 3.39% 5.57%
Average receive rate ........................................... 1.66% 3.02% 5.32%
Interest Rates
The Company’s major exposure to interest rate risk relates to changes in short-term investment interest rates,
both in the United States and Europe. The Company’s 8.50 percent debentures are payable in 2022.
Fair Value of Financial Instruments
The carrying value and estimated fair value of long-term debt was $142 million and $120 million, respectively, at
January 31, 2009 and $221 million and $216 million, respectively, at February 2, 2008. The carrying value and estimated
fair value of the Northern Group note was $14 million at February 2, 2008. The Northern Group note was fully impaired
during 2008. The carrying values of cash and cash equivalents, other short-term investments and other current
receivables and payables approximate their fair value.