Foot Locker 2008 Annual Report Download - page 59
Download and view the complete annual report
Please find page 59 of the 2008 Foot Locker annual report below. You can navigate through the pages in the report by either clicking on the pages listed below, or by using the keyword search tool below to find specific information within the annual report.-
 1
1 -
2
-
3
-
4
-
5
-
6
-
7
-
8
-
9
-
10
-
11
-
12
-
13
-
14
-
15
-
16
-
17
-
18
-
19
-
20
-
21
-
22
-
23
-
24
-
25
-
26
-
27
-
28
-
29
-
30
-
31
-
32
-
33
-
34
-
35
-
36
-
37
-
38
-
39
-
40
-
41
-
42
-
43
-
44
-
45
-
46
-
47
-
48
-
 49
49 -
 50
50 -
 51
51 -
 52
52 -
 53
53 -
 54
54 -
 55
55 -
 56
56 -
 57
57 -
 58
58 -
 59
59 -
 60
60 -
 61
61 -
 62
62 -
 63
63 -
 64
64 -
 65
65 -
 66
66 -
 67
67 -
 68
68 -
 69
69 -
70
-
71
-
72
-
73
-
74
-
75
-
76
-
77
-
78
-
79
-
80
-
81
-
82
-
83
-
84
-
85
-
86
-
87
-
88
-
89
-
90
-
91
-
92
-
93
-
94
-
95
-
96
-
97
-
98
-
99
 |
 |

43
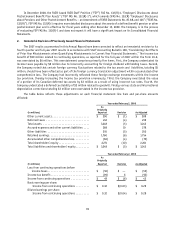
Operating Results
2008 2007 2006
(in millions)
Athletic Stores(1) ............................................. $ (59) $ (27) $ 405
Direct-to-Customers .......................................... 43 40 45
Family Footwear(2) ............................................ — (6) —
(16) 7 450
Restructuring income (charge)(3) ................................. — 2 (1)
Division (loss) profit .......................................... (16) 9 449
Corporate expense(4) .......................................... (87) (59) (68)
Operating (loss) profit ........................................ (103) (50) 381
Other income(5) .............................................. 8 1 14
Interest expense, net ......................................... 5 1 3
(Loss) income from continuing operations before income taxes ......... $ (100) $ (50) $ 392
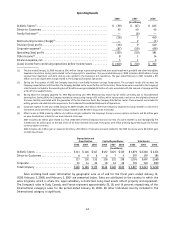
(1) The year ended January 31, 2009 includes a $241 million charge representing long-lived store asset impairment, goodwill and other intangibles
impairment and store closing costs related to the Company’s U.S. operations. The year ended February 2, 2008 includes a $128 million charge
representing impairment and store closing costs related to the Company’s U.S. operations. The year ended February 3, 2007 included a $17
million non-cash impairment charge related to the Company’s European operations.
(2) During the first quarter of 2007, the Company launched a new family footwear concept, Footquarters. The concept’s results did not meet the
Company’s expectations and, therefore, the Company decided not to invest further in this business. These stores were converted to the Company’s
other formats. Included in the operating loss of $6 million was approximately $2 million of costs associated with the removal of signage and the
write-off of unusable fixtures.
(3) During 2007, the Company adjusted its 1993 Repositioning and 1991 Restructuring reserve by $2 million primarily due to favorable lease
terminations. During 2006, the Company recorded a restructuring charge of $1 million, which represented a revision to the original estimate of
the lease liability associated with the guarantee of The San Francisco Music Box Company distribution center. These amounts are included in
selling, general and administrative expenses in the Condensed Consolidated Statements of Operations.
(4) Corporate expense for the year ended January 31, 2009 includes a $3 million other-than-temporary impairment charge related to a short-term
investment and a $15 million impairment charge related to the Northern Group note receivable.
(5) Other income in 2008 primarily reflects a $4 million net gain related to the Company’s foreign currency options contracts and $3 million gain
on lease terminations related to two lease interests in Europe.
2007 includes a $1 million gain related to a final settlement with the Company’s insurance carriers of a claim related to a store damaged by fire
in 2006 and a $1 million gain on the sale of two of its lease interests in Europe. These gains were offset primarily by premiums paid for foreign
currency option contracts.
2006 includes a $4 million gain on lease terminations, a $8 million of insurance proceeds related to the 2005 hurricane, and a $2 million gain
on debt repurchases.
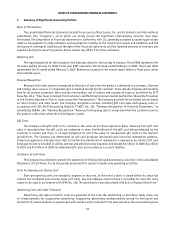
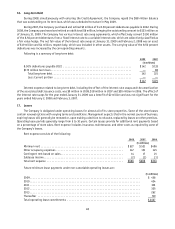
Depreciation and
Amortization Capital Expenditures Total Assets
2008 2007 2006 2008 2007 2006 2008 2007 2006
(in millions)
Athletic Stores ....................... $111 $146 $147 $122 $125 $135 $1,879 $2,300 $2,374
Direct-to-Customers ................... 6 6 6 6 7 4 297 197 195
117 152 153 128 132 139 2,176 2,497 2,569
Corporate ........................... 13 14 22 18 16 26 701 746 680
Total Company ....................... $130 $166 $175 $146 $148 $165 $2,877 $3,243 $3,249
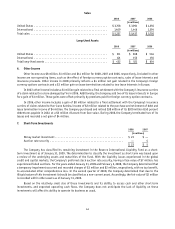
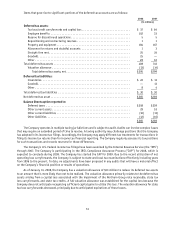
Sales and long-lived asset information by geographic area as of and for the fiscal years ended January 31,
2009, February 2, 2008, and February 3, 2007 are presented below. Sales are attributed to the country in which the
sales originate, which is where the legal subsidiary is domiciled. Long-lived assets reflect property and equipment.
The Company’s sales in Italy, Canada, and France represent approximately 22, 18, and 14 percent, respectively, of the
International category’s sales for the period ended January 31, 2009. No other individual country included in the
International category is significant.