Foot Locker 2008 Annual Report Download - page 30
Download and view the complete annual report
Please find page 30 of the 2008 Foot Locker annual report below. You can navigate through the pages in the report by either clicking on the pages listed below, or by using the keyword search tool below to find specific information within the annual report.-
 1
1 -
2
-
3
-
4
-
5
-
6
-
7
-
8
-
9
-
10
-
11
-
12
-
13
-
14
-
15
-
16
-
17
-
18
-
19
-
 20
20 -
 21
21 -
 22
22 -
 23
23 -
 24
24 -
 25
25 -
 26
26 -
 27
27 -
 28
28 -
 29
29 -
 30
30 -
 31
31 -
 32
32 -
 33
33 -
 34
34 -
 35
35 -
 36
36 -
 37
37 -
 38
38 -
 39
39 -
 40
40 -
41
-
42
-
43
-
44
-
45
-
46
-
47
-
48
-
49
-
50
-
51
-
52
-
53
-
54
-
55
-
56
-
57
-
58
-
59
-
60
-
61
-
62
-
63
-
64
-
65
-
66
-
67
-
68
-
69
-
70
-
71
-
72
-
73
-
74
-
75
-
76
-
77
-
78
-
79
-
80
-
81
-
82
-
83
-
84
-
85
-
86
-
87
-
88
-
89
-
90
-
91
-
92
-
93
-
94
-
95
-
96
-
97
-
98
-
99
 |
 |

14
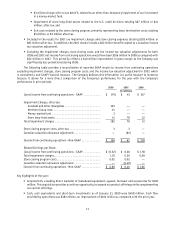
Depreciation and Amortization
Depreciation and amortization of $130 million decreased by 21.7 percent in 2008 from $166 million in 2007. This
decrease primarily reflects the effect of the 2007 impairment charges offset, in part, by increased depreciation and
amortization related to the Company’s capital spending. The effect of foreign currency fluctuations was not significant.
Due to the 2008 impairment charges, the Company expects that its 2009 depreciation and amortization expense will be
approximately $15 million lower than 2008.
Depreciation and amortization of $166 million decreased by 5.1 percent in 2007 from $175 million in 2006. This
decrease primarily reflects reduced software amortization of $8 million as assets became fully depreciated and reduced
depreciation and amortization associated with the third quarter 2007 impairment charge. These decreases were offset,
in part, by the effect of foreign currency fluctuations, which increased depreciation and amortization expense by $3
million, and increased depreciation and amortization related to the Company’s capital spending.
Interest Expense, Net
2008 2007 2006
(in millions)
Interest expense ............................................. $ 16 $ 21 $ 23
Interest income.............................................. (11) (20) (20)
Interest expense, net ....................................... $ 5 $ 1 $ 3
Weighted-average interest rate (excluding facility fees):
Long-term debt............................................ 6.2% 8.0% 7.8%
Interest expense of $16 million decreased by 23.8 percent in 2008 compared to $21 million in 2007. The reduction
in interest expense primarily relates to the repayment of the term loan in May 2008 and the purchases and retirements
of $6 million and $5 million in 2008 and 2007, respectively, of the Company’s 8.50 percent debentures. The Company did
not have any short-term borrowings for any of the periods presented. Interest rate swap agreements reduced interest
expense in 2008 by approximately $2 million, while the cross currency swaps increased interest expense by $3 million.
Interest income of $11 million declined from $20 million in 2007. Interest income is generated through the investment
of cash equivalents and short-term investments. The decline in interest income reflects the lower interest income
on cash, cash equivalents and short-term investments, which totaled $10 million in 2008 and $16 million in 2007.
Additionally, the Company did not record accretion income related to the Northern Group note, which in the prior year
totaled $2 million.
Interest expense of $21 million decreased by 8.7 percent in 2007 as compared with $23 million in 2006. The
reduction in interest expense primarily relates to the purchases and retirements of $5 million and $38 million in 2007
and 2006, respectively, of the Company’s 8.50 percent debentures. Interest rate swap agreements did not significantly
affect interest expense in 2007. Interest income of $20 million remained unchanged from 2006. Interest income
related to cash, cash equivalents and short-term investments was $16 million in 2007 and $14 million in 2006. Interest
income on the Northern Group note amounted to $2 million in both 2007 and 2006. Income from the cross currency
swaps totaled $1 million in 2007 as compared with $3 million in 2006.
Other Income
Other income of $8 million in 2008 includes a net gain of $4 million, which is comprised of the changes in
fair value, realized gains and premiums paid on foreign currency contracts. The Company uses these derivatives to
mitigate the effect of fluctuating foreign exchange rates on the reporting of foreign currency denominated earnings.
Additionally, 2008 includes a $3 million gain on lease terminations related to two lease interests in Europe.
In 2007, other income included a $1 million gain related to a final settlement with the Company’s insurance
carriers of a claim related to a store damaged by a fire in 2006. Additionally, the Company sold two of its lease interests
in Europe for a gain of $1 million. These gains were offset primarily by premiums paid for foreign currency option
contracts. The 2006 amounts included a net gain of $4 million from the termination of two of the Company’s leases for
approximately $5 million and insurance claims related to Hurricane Katrina that resulted in a gain of $8 million, which
represented amounts in excess of losses. Also during 2006, the Company purchased and retired $38 million of long-term
debt at a discount from face value of $2 million.