Foot Locker 2008 Annual Report Download - page 36
Download and view the complete annual report
Please find page 36 of the 2008 Foot Locker annual report below. You can navigate through the pages in the report by either clicking on the pages listed below, or by using the keyword search tool below to find specific information within the annual report.-
 1
1 -
2
-
3
-
4
-
5
-
6
-
7
-
8
-
9
-
10
-
11
-
12
-
13
-
14
-
15
-
16
-
17
-
18
-
19
-
20
-
21
-
22
-
23
-
24
-
25
-
 26
26 -
 27
27 -
 28
28 -
 29
29 -
 30
30 -
 31
31 -
 32
32 -
 33
33 -
 34
34 -
 35
35 -
 36
36 -
 37
37 -
 38
38 -
 39
39 -
 40
40 -
 41
41 -
 42
42 -
 43
43 -
 44
44 -
 45
45 -
 46
46 -
47
-
48
-
49
-
50
-
51
-
52
-
53
-
54
-
55
-
56
-
57
-
58
-
59
-
60
-
61
-
62
-
63
-
64
-
65
-
66
-
67
-
68
-
69
-
70
-
71
-
72
-
73
-
74
-
75
-
76
-
77
-
78
-
79
-
80
-
81
-
82
-
83
-
84
-
85
-
86
-
87
-
88
-
89
-
90
-
91
-
92
-
93
-
94
-
95
-
96
-
97
-
98
-
99
 |
 |

20
2008 2007
(in millions)
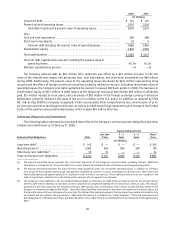
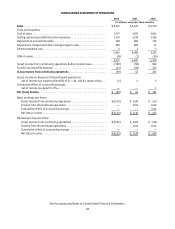
Long-term debt .................................................. $ 142 $ 221
Present value of operating leases .................................... 1,952 2,126
Total debt including the present value of operating leases................ 2,094 2,347
Less:
Cash and cash equivalents.......................................... 385 488
Short-term investments............................................ 23 5
Total net debt including the present value of operating leases ............. 1,686 1,854
Shareholders’ equity .............................................. 1,924 2,261
Total capitalization . . . . . . . . . . . . . . . . . . . . . . . . . . . . . . . . . . . . . . . . . . . . . . . $ 3,610 $ 4,115
Total net debt capitalization percent including the present value of
operating leases............................................... 46.7% 45.1%
Net debt capitalization percent...................................... —% —%
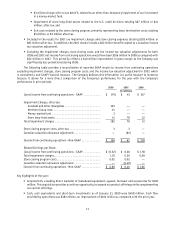
The Company reduced debt by $94 million (this reduction was offset by a $15 million increase in the fair
value of the interest rate swaps), and decreased cash, cash equivalents, and short-term investments by $85 million
during 2008. Additionally, the present value of the operating leases decreased by $174 million representing store
closures and the effect of foreign currency fluctuations primarily related to the euro. Including the present value of
operating leases, the Company’s net debt capitalization percent increased 160 basis points in 2008. The decrease in
shareholders’ equity of $337 million in 2008 relates to the following: net loss of $80 million, $93 million in dividends
paid, $12 million related to stock plans, and a decrease of $83 million in the foreign exchange currency translation
adjustment, primarily related to the value of the euro in relation to the U.S. dollar. In addition, as required by SFAS
No. 158, during 2008 the Company recognized, within accumulated other comprehensive loss, amortization of prior
service costs and net actuarial gains and losses, as well as an additional charge representing the change in the funded
status of the pension and postretirement plans, which totaled $91 million after-tax.
Contractual Obligations and Commitments
The following tables represent the scheduled maturities of the Company’s contractual cash obligations and other
commercial commitments as of January 31, 2009:
Payments Due by Period
Contractual Cash Obligations Total
Less than
1 Year
2 – 3
Years
3 – 5
Years
After 5
Years
(in millions)
Long-term debt(1) ....................... $ 142 $ — $ — $ — $142
Operating leases(2) ...................... 2,567 456 805 587 719
Other long-term liabilities(3) ............... 35 11 — — 24
Total contractual cash obligations .......... $2,744 $467 $805 $587 $885
(1) The amounts presented above represent the contractual maturities of the Company’s long-term debt, excluding interest. Additional
information is included in the “Long-Term Debt” note under “Item 8. Consolidated Financial Statements and Supplementary Data.”
(2) The amounts presented represent the future minimum lease payments under non-cancelable operating leases. In addition to minimum
rent, certain of the Company’s leases require the payment of additional costs for insurance, maintenance, and other costs. These costs have
historically represented approximately 25 to 30 percent of the minimum rent amount. These additional amounts are not included in the
table of contractual commitments as the timing and/or amounts of such payments are unknown.
(3) The Company’s other liabilities in the Consolidated Balance Sheet as of January 31, 2009 primarily comprise pension and postretirement
benefits, deferred rent liability, income taxes, workers’ compensation and general liability reserves and various other accruals. The amounts
presented in the table comprises the Company’s February 2009 pension plan contributions of $11 million and the liability related to the
European net investment hedge of $24 million. Other than these liabilities, other amounts have been excluded from the above table as the
timing and/or amount of any cash payment is uncertain. The timing of the remaining amounts that are known have not been included as they
are minimal and not useful to the presentation. Additional information is included in the “Other Liabilities,” “Financial Instruments and
Risk Management,” and “Retirement Plans and Other Benefits” notes under “Item 8. Consolidated Financial Statements and Supplementary
Data.”