Foot Locker 2008 Annual Report Download - page 29
Download and view the complete annual report
Please find page 29 of the 2008 Foot Locker annual report below. You can navigate through the pages in the report by either clicking on the pages listed below, or by using the keyword search tool below to find specific information within the annual report.-
 1
1 -
2
-
3
-
4
-
5
-
6
-
7
-
8
-
9
-
10
-
11
-
12
-
13
-
14
-
15
-
16
-
17
-
18
-
 19
19 -
 20
20 -
 21
21 -
 22
22 -
 23
23 -
 24
24 -
 25
25 -
 26
26 -
 27
27 -
 28
28 -
 29
29 -
 30
30 -
 31
31 -
 32
32 -
 33
33 -
 34
34 -
 35
35 -
 36
36 -
 37
37 -
 38
38 -
 39
39 -
40
-
41
-
42
-
43
-
44
-
45
-
46
-
47
-
48
-
49
-
50
-
51
-
52
-
53
-
54
-
55
-
56
-
57
-
58
-
59
-
60
-
61
-
62
-
63
-
64
-
65
-
66
-
67
-
68
-
69
-
70
-
71
-
72
-
73
-
74
-
75
-
76
-
77
-
78
-
79
-
80
-
81
-
82
-
83
-
84
-
85
-
86
-
87
-
88
-
89
-
90
-
91
-
92
-
93
-
94
-
95
-
96
-
97
-
98
-
99
 |
 |

13
Sales decreased to $5,237 million, or by 3.7 percent as compared with 2007. Excluding the effect of foreign currency
fluctuations, sales declined 4.0 percent as compared with 2007. Comparable-store sales decreased by 3.2 percent.
Sales of $5,437 million in 2007 decreased by 5.4 percent from sales of $5,750 million in 2006. Excluding the
effect of foreign currency fluctuations, sales declined 7.6 percent as compared with 2006. Comparable-store sales
decreased by 6.3 percent.
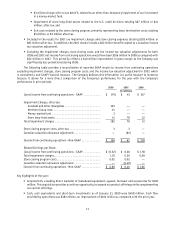
Gross Margin
Gross margin as a percentage of sales was 27.9 percent in 2008 increasing 180 basis points as compared with
2007. The increase in the gross margin represented an increase of 230 basis points in the merchandise margin rate
reflecting lower markdowns. Lower sales in 2008 resulted in the occupancy rate increasing by 50 basis points, as a
percentage of sales. The effect of reduced vendor allowances was not significant as compared with 2007.
Gross margin as a percentage of sales was 26.1 percent in 2007 declining 410 basis points as compared with
2006. Gross margin, as a percentage of sales, was negatively affected primarily by incremental markdowns, of 180
basis points, taken to liquidate slow-moving and excess inventory and the effect of reduced vendor allowances, which
negatively affected gross margin by approximately 60 basis points, as compared with 2006. Lower sales in 2007
resulted in the occupancy rate increasing by 160 basis points, as a percentage of sales.
Selling, General and Administrative Expenses
Selling, general and administrative (“SG&A”) expenses decreased by $2 million to $1,174 million in 2008, or
by 0.2 percent, as compared with 2007. SG&A as a percentage of sales increased to 22.4 percent as compared with
21.6 percent in 2007. The increase in SG&A as a percentage of sales is due to the decline in sales. Excluding the
effect of foreign currency fluctuations in 2008, SG&A decreased by $9 million. This decrease reflects lower divisional
expenses reflecting fewer stores, offset, in part, by an increase in corporate expenses primarily related to increased
incentive compensation.
SG&A expenses increased by $13 million to $1,176 million in 2007, or by 1.1 percent, as compared with 2006. SG&A
as a percentage of sales increased to 21.6 percent as compared with 20.2 percent in 2006. The increase in SG&A as a
percentage of sales is due to the decline in sales. Excluding the effect of foreign currency fluctuations and the 53rd
week in 2006, SG&A decreased by $2 million. This decrease primarily reflected savings associated with operating fewer
stores, as well as controlling variable expenses as compared with the prior-year period.
Corporate Expense
Corporate expense consists of unallocated general and administrative expenses as well as depreciation and
amortization related to the Company’s corporate headquarters, centrally managed departments, unallocated insurance
and benefit programs, certain foreign exchange transaction gains and losses, and other items.
Corporate expense increased by $28 million to $87 million in 2008 as compared with 2007. Depreciation and
amortization included in corporate expense amounted to $13 million in 2008 and $14 million in 2007. Corporate
expense for 2008 includes a $3 million other-than-temporary impairment charge related to a short-term investment and
a $15 million impairment charge related to the Northern Group note receivable. During the first quarter of 2008, the
principal owners of the Northern Group requested an extension on the repayment of the note, which was scheduled to
be repaid on September 28, 2008. The Company determined, based on the Northern Group’s current financial condition
and projected performance, that repayment of the note pursuant to the original terms of the purchase agreement was
not likely. Excluding these charges, corporate expense increased by $10 million, which is primarily related to increased
incentive compensation.
Corporate expense decreased by $9 million to $59 million in 2007 as compared with 2006. Depreciation and
amortization included in corporate expense amounted to $14 million in 2007 and $22 million in 2006, the decrease
reflecting certain software assets, which were fully depreciated. Excluding the change in corporate expense related
to depreciation and amortization, corporate expense declined primarily due to reduced incentive compensation
expense.