Foot Locker 2008 Annual Report Download - page 32
Download and view the complete annual report
Please find page 32 of the 2008 Foot Locker annual report below. You can navigate through the pages in the report by either clicking on the pages listed below, or by using the keyword search tool below to find specific information within the annual report.-
 1
1 -
2
-
3
-
4
-
5
-
6
-
7
-
8
-
9
-
10
-
11
-
12
-
13
-
14
-
15
-
16
-
17
-
18
-
19
-
20
-
21
-
 22
22 -
 23
23 -
 24
24 -
 25
25 -
 26
26 -
 27
27 -
 28
28 -
 29
29 -
 30
30 -
 31
31 -
 32
32 -
 33
33 -
 34
34 -
 35
35 -
 36
36 -
 37
37 -
 38
38 -
 39
39 -
 40
40 -
 41
41 -
 42
42 -
43
-
44
-
45
-
46
-
47
-
48
-
49
-
50
-
51
-
52
-
53
-
54
-
55
-
56
-
57
-
58
-
59
-
60
-
61
-
62
-
63
-
64
-
65
-
66
-
67
-
68
-
69
-
70
-
71
-
72
-
73
-
74
-
75
-
76
-
77
-
78
-
79
-
80
-
81
-
82
-
83
-
84
-
85
-
86
-
87
-
88
-
89
-
90
-
91
-
92
-
93
-
94
-
95
-
96
-
97
-
98
-
99
 |
 |

16
using forward-looking projections of estimated future operating results and a guideline company methodology under
the market approach. Based on this testing, the Company determined that the fair values, as determined under step 1
as described above, was less than the carrying values of the Foot Locker, Kids Foot Locker and Footaction reporting unit
and the Champs Sports reporting unit. Accordingly, the Company performed a step 2 analysis to determine the extent of
the goodwill impairment and concluded that the goodwill of these two reporting units was fully impaired, resulting in
a non-cash impairment charge of $167 million. There were no goodwill impairment charges in 2007 or 2006. Excluding
the impairment charges and store exit costs from both 2008 and 2007, division profit would have increased to $182
million in 2008 from $101 million in 2007. This increase in division profit primarily related to the domestic divisions as
a result of lower promotional markdowns and reduced depreciation and amortization expense.
2007 compared with 2006
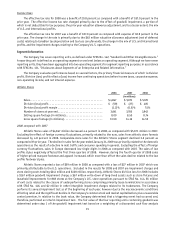
Athletic Stores sales of $5,071 million decreased 5.6 percent in 2007, as compared with $5,370 million in 2006.
Excluding the effect of foreign currency fluctuations, primarily related to the euro, sales from athletic store formats
decreased by 7.8 percent in 2007. The decline in sales for the year ended February 2, 2008 was primarily related to the
domestic operations. Sales in the U.S. were negatively affected by a continuing weakening in consumer spending,
unseasonable warmer weather, and a lack of clear fashion trend in athletic footwear and apparel. Internationally,
comparable-store sales declined mid-single digits. In Europe, sales of low-profile footwear styles declined, while the
sales trend of higher priced technical footwear was higher than the prior year. Comparable-store sales for the Athletic
Stores segment decreased by 6.6 percent in 2007.
Athletic Stores reported a loss of $27 million in 2007 as compared with a profit of $405 million in 2006. The
decrease in division profit was attributable to the U.S. operations. The decline in the U.S. operations was offset, in
part, by increases in most international formats. Included in the Athletic Stores division results for 2007 are non-cash
impairment charges of $117 million to write-down long-lived assets such as store fixtures and leasehold improvements
for 1,395 stores at the Company’s U.S. store operations pursuant to SFAS No. 144, consistent with the Company’s
recoverability of long-lived assets policy. Additionally, in 2007, the Company identified unproductive stores for closure;
accordingly, the Company evaluated the recoverability of long-lived assets considering the revised estimated future
cash flows. The Company recorded an additional non-cash impairment charge of $7 million as a result of this analysis.
Exit costs related to 33 stores that closed during 2007, comprising primarily lease termination costs of $4 million, were
recognized in accordance with SFAS No. 146.
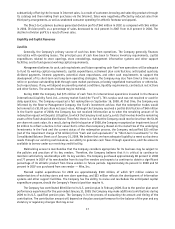
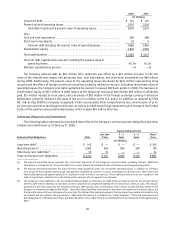
Direct-to-Customers
2008 2007 2006
(in millions)
Sales ................................................... $390 $ 364 $380
Division profit ........................................... $ 43 $ 40 $ 45
Division profit margin ...................................... 11.0% 11.0% 11.8%
2008 compared with 2007
Direct-to-Customers sales increased 7.1 percent to $390 million in 2008, as compared with $364 million in 2007,
reflecting a comparable-sales increase of 1.0 percent and additional sales from CCS, which was acquired during the
fourth quarter of 2008. Internet sales increased by 12.2 percent to $322 million, as compared with 2007. Catalog sales
decreased by 11.7 percent to $68 million in 2008 from $77 million in 2007. Management believes that the decrease in
catalog sales, which was substantially offset by the increase in Internet sales, is a result of customers browsing and
selecting products through its catalogs and then making their purchases via the Internet.
The Direct-to-Customers business generated division profit of $43 million in 2008, as compared with $40 million
in 2007. Division profit, as a percentage of sales, was 11.0 percent in 2008 and 2007. The increase in division profit
reflects the accretive effect of the acquisition of CCS.
2007 compared with 2006
Direct-to-Customers sales decreased 4.2 percent to $364 million in 2007, as compared with $380 million in 2006.
Internet sales increased by 6.3 percent to $287 million, as compared with 2006. Catalog sales decreased by 30.0 percent
to $77 million in 2007 from $110 million in 2006. Management believes that the decrease in catalog sales, which was