Foot Locker 2008 Annual Report Download - page 5
Download and view the complete annual report
Please find page 5 of the 2008 Foot Locker annual report below. You can navigate through the pages in the report by either clicking on the pages listed below, or by using the keyword search tool below to find specific information within the annual report.-
 1
1 -
 2
2 -
 3
3 -
 4
4 -
 5
5 -
 6
6 -
 7
7 -
 8
8 -
 9
9 -
 10
10 -
 11
11 -
 12
12 -
 13
13 -
 14
14 -
 15
15 -
 16
16 -
17
-
18
-
19
-
20
-
21
-
22
-
23
-
24
-
25
-
26
-
27
-
28
-
29
-
30
-
31
-
32
-
33
-
34
-
35
-
36
-
37
-
38
-
39
-
40
-
41
-
42
-
43
-
44
-
45
-
46
-
47
-
48
-
49
-
50
-
51
-
52
-
53
-
54
-
55
-
56
-
57
-
58
-
59
-
60
-
61
-
62
-
63
-
64
-
65
-
66
-
67
-
68
-
69
-
70
-
71
-
72
-
73
-
74
-
75
-
76
-
77
-
78
-
79
-
80
-
81
-
82
-
83
-
84
-
85
-
86
-
87
-
88
-
89
-
90
-
91
-
92
-
93
-
94
-
95
-
96
-
97
-
98
-
99
 |
 |

categories throughout the year, and
improvements in our branded apparel
business began to emerge. Additionally,
due to our improved inventory position,
our clearance markdown activity dur-
ing the year was significantly lower than
the prior year, leading to a significant
increase in our gross margin rate.
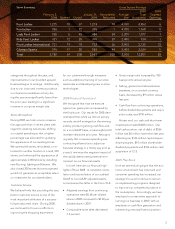
Store Atmosphere
During 2008, we took a more conserva-
tive approach than in recent years with
regard to opening new stores, shifting
our capital spending so that a higher
percentage was allocated to updating
the appearance of our existing stores.
We opened 64 stores; remodeled, or re-
located to another location in a mall, 230
stores; and enhanced the appearance of
approximately 2,000 stores by installing
new flooring, lighting and fixtures. We
also closed 208 stores that we projected
would not generate an acceptable return
on investment for our shareholders.
Customer Service
We believe firmly that providing the very
best in customer service is one of the
most important attributes of a success-
ful specialty retail chain. During 2008,
we continued to focus our efforts on
improving the shopping experience
for our customers through measures
such as additional training of our store
associates and developing new in-store
technologies.
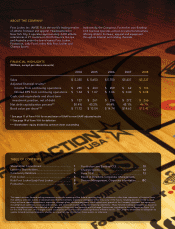
2008 Financial Scorecard
We recognize that how we execute
against our game plan is measured by
the final score. Our results for 2008 dem-
onstrated that, while we did not set any
records, we still emerged on the winning
side by producing strong cash flow and,
on a non-GAAP basis, a meaningful profit
increaseversustheprioryear.Recogniz-
ing early that consumer spending was
contracting allowed us to adjust our
business strategy in a timely way and, as
a result, minimize the negative impact of
the rapidly deteriorating external envi-
ronment on our financial results.
In brief, here are our financial high-
lights of fiscal 2008. A complete compi-
lation and reconciliation of our audited
GAAP to non-GAAP adjusted results,
accompanies this letter in the Form 10-K.
• Adjustedearningsfromcontinuing
operations were $0.68 per diluted
share in 2008 compared to $0.40 per
diluted share in 2007.
• Comparable-storesalesdecreased
3.2 percent.
• Grossmarginrateincreasedby180
basis points versus last year.
• Selling,generalandadministrative
expenses, on a constant currency
basis, decreased by $9 million versus
last year.
• Cashowfromcontinuingoperations,
before dividends payments and acqui-
sition costs, was $190 million.
At year end, our cash and short-term
investments totaled $408 million. Our
total cash position, net of debt, of $266
million was $6 million lower than last year
reflecting our $146 million capital expen-
diture program, $93 million shareholder
dividend payments and $106 million cash
acquisition of CCS.
2009 Play Book
Until we see enduring signs that the eco-
nomic environment has improved and
consumer spending has increased, our
strategic focus will continue to remain
on implementing programs designed
to improve our competitive position in
the marketplace. Accordingly, we have
employed a conservative approach to
running our business in 2009, with an
emphasis on cash flow generation and
maintaining a strong financial position.
3
Store Summary Gross Square Footage
2008 2009
February 2, January 31, Remodeled/ Average Total Targeted
2008 Opened Closed 2009 Relocated Size (thousands) Openings
Foot Locker 1,275 10 67 1,218 78 4,100 4,953 6
Footaction 356 1 22 335 1 4,700 1,568 0
Lady Foot Locker 526 5 45 486 34 2,200 1,077 1
Kids Foot Locker 321 12 28 305 37 2,400 734 1
Foot Locker International 731 19 18 732 36 2,900 2,135 12
Champs Sports 576 17 28 565 44 5,400 3,034 5
Total 3,785 64 208 3,641 230 3,700 13,501 25