Chevron 2005 Annual Report Download - page 99
Download and view the complete annual report
Please find page 99 of the 2005 Chevron annual report below. You can navigate through the pages in the report by either clicking on the pages listed below, or by using the keyword search tool below to find specific information within the annual report.-
 1
1 -
2
-
3
-
4
-
5
-
6
-
7
-
8
-
9
-
10
-
11
-
12
-
13
-
14
-
15
-
16
-
17
-
18
-
19
-
20
-
21
-
22
-
23
-
24
-
25
-
26
-
27
-
28
-
29
-
30
-
31
-
32
-
33
-
34
-
35
-
36
-
37
-
38
-
39
-
40
-
41
-
42
-
43
-
44
-
45
-
46
-
47
-
48
-
49
-
50
-
51
-
52
-
53
-
54
-
55
-
56
-
57
-
58
-
59
-
60
-
61
-
62
-
63
-
64
-
65
-
66
-
67
-
68
-
69
-
70
-
71
-
72
-
73
-
74
-
75
-
76
-
77
-
78
-
79
-
80
-
81
-
82
-
83
-
84
-
85
-
86
-
87
-
88
-
 89
89 -
 90
90 -
 91
91 -
 92
92 -
 93
93 -
 94
94 -
 95
95 -
 96
96 -
 97
97 -
 98
98 -
 99
99 -
 100
100 -
 101
101 -
 102
102 -
 103
103 -
 104
104 -
 105
105 -
 106
106 -
 107
107 -
 108
108
 |
 |

CHEVRON CORPORATION 2005 ANNUAL REPORT 97
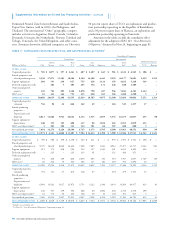
TABLE V – RESERVE QUANTITY INFORMATION – Continued
duction-sharing contract. In the United States, the 68
million-barrel net downward revision in the Gulf of Mexico
area was across several fi elds and based mainly on reservoir
analyses and assessments of well performance. For affi liated
companies, the 206 million-barrel increase for TCO was
based on an updated assessment of reservoir performance
for the Tengiz Field. Partially offsetting this increase was a
downward effect of higher year-end prices on the variable
royalty-rate calculation. Downward revisions also occurred
in other geographic areas because of the effect of higher year-
end prices on various production-sharing terms and variable
royalty calculations.
In 2005, net revisions reduced reserves by 239 million
and 24 million barrels for worldwide consolidated com-
panies and equity affi liates, respectively. For consolidated
companies, the net decrease was 199 million barrels in the
international areas and 40 million barrels in the United
States. The largest downward net revisions internationally
were 108 million barrels in Indonesia and 53 million barrels
in Kazakhstan, due primarily to the effect of higher year-end
prices on the calculation of reserves associated with production-
sharing and variable-royalty contracts. In the United States,
the 40 million-barrel reduction was across many fi elds in each
of the geographic sections. Most of the downward revision
for affi liated companies was a 19 million-barrel reduction in
Hamaca, attributable to revised government royalty provisions.
For TCO, the downward effect of higher year-end prices was
partially offset by increased reservoir performance.
Improved Recovery In 2005, improved recovery increased
liquids volumes worldwide by 203 million barrels for con-
solidated companies. International areas accounted for
142 million barrels of the increase. Indonesia added 42 mil-
lion barrels due to improved performance. Reserve additions
of 67 million barrels in Africa occurred primarily in Angola
and resulted from infi ll drilling, wells workovers and sec-
ondary recovery from gas injection. Additions of 29 million
barrels in the “Other” international area were mainly attrib-
utable to improved waterfl ood performance offshore eastern
Canada. An increase of 61 million barrels occurred in the
United States, primarily in California due to improved per-
formance on a large heavy oil fi eld under thermal recovery.
Extensions and Discoveries In 2005, extensions and dis-
coveries increased liquids volumes worldwide by 184 million
barrels for consolidated companies. The largest increase was
49 million barrels in Nigeria, refl ecting new development drill-
ing, including in the Agbami Field, among others. New fi eld
developments in Brazil contributed another 41 million barrels
of discoveries. In the United States, the 44 million-barrel
addition was associated mainly with the initial booking of
reserves for the Blind Faith Field in the deepwater Gulf
of Mexico.
Purchases In 2005, the acquisition of 572 million
barrels of liquids related solely to the acquisition of Unocal
in August. About three-fourths of the 376 million bar-
rels acquired in the international areas were represented by
volumes in Azerbaijan and Thailand. Most volumes acquired
in the United States were in Texas and Alaska.
Sales In 2004, sales of liquids volumes reduced reserves
of consolidated companies by 179 million barrels. Sales
totaled 130 million barrels in the United States and 33 mil-
lion barrels in the “Other” international region. Sales in the
“Other” region of the United States totaled 103 million bar-
rels, with two fi elds accounting for approximately one-half
of the volume. The 27 million barrels sold in the Gulf of
Mexico refl ect the sale of a number of Shelf properties. The
“Other” international sales include the disposal of western
Canada properties and several fi elds in the United Kingdom.
All the sales were associated with the company’s program to
dispose of assets deemed nonstrategic to the portfolio of pro-
ducing properties.
In 2005, sales of 58 million barrels in the “Other” inter-
national area related to the disposition of the former Unocal
operations onshore in Canada.