Chevron 2005 Annual Report Download - page 88
Download and view the complete annual report
Please find page 88 of the 2005 Chevron annual report below. You can navigate through the pages in the report by either clicking on the pages listed below, or by using the keyword search tool below to find specific information within the annual report.-
 1
1 -
2
-
3
-
4
-
5
-
6
-
7
-
8
-
9
-
10
-
11
-
12
-
13
-
14
-
15
-
16
-
17
-
18
-
19
-
20
-
21
-
22
-
23
-
24
-
25
-
26
-
27
-
28
-
29
-
30
-
31
-
32
-
33
-
34
-
35
-
36
-
37
-
38
-
39
-
40
-
41
-
42
-
43
-
44
-
45
-
46
-
47
-
48
-
49
-
50
-
51
-
52
-
53
-
54
-
55
-
56
-
57
-
58
-
59
-
60
-
61
-
62
-
63
-
64
-
65
-
66
-
67
-
68
-
69
-
70
-
71
-
72
-
73
-
74
-
75
-
76
-
77
-
 78
78 -
 79
79 -
 80
80 -
 81
81 -
 82
82 -
 83
83 -
 84
84 -
 85
85 -
 86
86 -
 87
87 -
 88
88 -
 89
89 -
 90
90 -
 91
91 -
 92
92 -
 93
93 -
 94
94 -
 95
95 -
 96
96 -
 97
97 -
 98
98 -
99
-
100
-
101
-
102
-
103
-
104
-
105
-
106
-
107
-
108
 |
 |

86 CHEVRON CORPORATION 2005 ANNUAL REPORT
Notes to the Consolidated Financial Statements
Millions of dollars, except per-share amounts
NOTE 26.
COMMON STOCK SPLIT
On July 28, 2004, the company’s Board of Directors approved
a two-for-one stock split in the form of a stock dividend to
the company’s stockholders of record on August 19, 2004,
with distribution of shares on September 10, 2004. The
total number of authorized common stock shares and associ-
ated par value were unchanged by this action. All per-share
amounts in the fi nancial statements refl ect the stock split for
all periods presented. The effect of the common stock split is
refl ected on the Consolidated Balance Sheet in “Common
stock” and “Capital in excess of par value.”
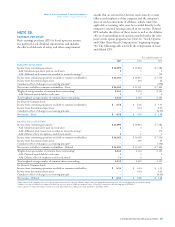
NOTE 27.
OTHER FINANCIAL INFORMATION
Net income in 2004 included gains of approximately $1.2 bil-
lion relating to the sale of nonstrategic upstream properties.
Other fi nancial information is as follows:
Year ended December 31
2005 2004 2003
Tot al fi nancing interest and debt costs $ 542 $ 450 $ 549
Less: Capitalized interest 60 44 75
Interest and debt expense $ 482 $ 406 $ 474
Research and development expenses $ 316 $ 242 $ 228
Foreign currency effects* $ (61) $ (81) $ (404)
* Includes $(2), $(13) and $(96) in 2005, 2004 and 2003, respectively, for the company’s
share of equity affi liates’ foreign currency effects.
The excess of market value over the carrying value of
inventories for which the LIFO method is used was $4,846,
$3,036 and $2,106 at December 31, 2005, 2004 and 2003,
respectively. Market value is generally based on average
acquisition costs for the year. LIFO profi ts of $34, $36 and
$82 were included in net income for the years 2005, 2004
and 2003, respectively.