Chevron 2005 Annual Report Download - page 39
Download and view the complete annual report
Please find page 39 of the 2005 Chevron annual report below. You can navigate through the pages in the report by either clicking on the pages listed below, or by using the keyword search tool below to find specific information within the annual report.-
 1
1 -
2
-
3
-
4
-
5
-
6
-
7
-
8
-
9
-
10
-
11
-
12
-
13
-
14
-
15
-
16
-
17
-
18
-
19
-
20
-
21
-
22
-
23
-
24
-
25
-
26
-
27
-
28
-
 29
29 -
 30
30 -
 31
31 -
 32
32 -
 33
33 -
 34
34 -
 35
35 -
 36
36 -
 37
37 -
 38
38 -
 39
39 -
 40
40 -
 41
41 -
 42
42 -
 43
43 -
 44
44 -
 45
45 -
 46
46 -
 47
47 -
 48
48 -
 49
49 -
50
-
51
-
52
-
53
-
54
-
55
-
56
-
57
-
58
-
59
-
60
-
61
-
62
-
63
-
64
-
65
-
66
-
67
-
68
-
69
-
70
-
71
-
72
-
73
-
74
-
75
-
76
-
77
-
78
-
79
-
80
-
81
-
82
-
83
-
84
-
85
-
86
-
87
-
88
-
89
-
90
-
91
-
92
-
93
-
94
-
95
-
96
-
97
-
98
-
99
-
100
-
101
-
102
-
103
-
104
-
105
-
106
-
107
-
108
 |
 |

CHEVRON CORPORATION 2005 ANNUAL REPORT 37
2005 also included $7.5 billion in cash. Unocal balances of
cash, cash equivalents and marketable securities at the acqui-
sition date totaled $1.6 billion.
Dividends The company paid dividends of approximately
$3.8 billion in 2005, $3.2 billion in 2004 and $3 billion in
2003. In April 2005, the company increased its quarterly com-
mon stock dividend by 12.5 percent to 45 cents per share.
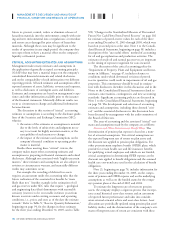
Debt, capital lease and minority interest obligations Tot a l
debt and capital lease balances were $12.9 billion at Decem-
ber 31, 2005, up from $11.3 billion at year-end 2004. The
2005 year-end balance included approximately $2.2 billion
of debt and capital lease obligations assumed with the acqui-
sition of Unocal. The company also had minority interest
obligations of $200 million, up from $172 million at Decem-
ber 31, 2004.
The company’s debt and capital lease obligations due
within one year, consisting primarily of commercial paper
and the current portion of long-term debt, totaled $5.6 bil-
lion at December 31, 2005, unchanged from December 31,
2004. Of these amounts, $4.9 billion and $4.7 billion were
reclassifi ed to long-term at the end of each period, respec-
tively. At year-end 2005, settlement of these obligations was
not expected to require the use of working capital in 2006,
as the company had the intent and the ability, as evidenced
by committed credit facilities, to refi nance them on a long-
term basis. The company’s practice has been to continually
refi nance its commercial paper, maintaining levels it believes
appropriate and economic.
At year-end 2005, the company had $4.9 billion in
committed credit facilities with various major banks, which
permitted the refi nancing of short-term obligations on a
long-term basis. These facilities support commercial paper
borrowings and also can be used for general corporate
purposes. The company’s practice has been to continually
replace expiring commitments with new commitments on
substantially the same terms, maintaining levels management
INFORMATION RELATED TO INVESTMENT IN
DYNEGY INC.
At year-end 2005, Chevron owned an approximate 24
percent equity interest in the common stock of Dynegy, a
provider of electricity to markets and customers throughout
the United States. The company also held an investment in
Dynegy preferred stock.
Investment in Dynegy Common Stock At December 31,
2005, the carrying value of the company’s investment in
Dynegy common stock was approximately $300 million.
This amount was about $200 million below the company’s
proportionate interest in Dynegy’s underlying net assets.
This difference is primarily the result of write-downs of the
investment in 2002 for declines in the market value of the
common shares below the company’s carrying value that were
deemed to be other than temporary. The difference had been
assigned to the extent practicable to specifi c Dynegy assets
and liabilities, based upon the company’s analysis of the vari-
ous factors associated with the decline in value of the Dynegy
shares. The company’s equity share of Dynegy’s reported
earnings is adjusted quarterly when appropriate to recognize
a portion of the difference between these allocated values
and Dynegy’s historical book values. The market value of the
company’s investment in Dynegy’s common stock at the end
of 2005 was approximately $470 million.
Investments in Dynegy Preferred Stock At the end of
2005, the company held $400 million face value of Dynegy
Series C Convertible Preferred Stock with a stated maturity
of 2033. The stock is accounted for at its fair value, which
was estimated to be $360 million at year-end 2005. Tempo-
rary changes in the estimated fair value of the preferred stock
are reported in “Other Comprehensive Income.” However, if
in any future period a decline in fair value is deemed to be
other than temporary, a charge against income in the period
would be recorded. Dividends received from the preferred
stock are recorded to income in the period received.
LIQUIDITY AND CAPITAL RESOURCES
Cash, cash equivalents and marketable securities Total ba la nces
were $11.1 billion and $10.7 billion at December 31, 2005
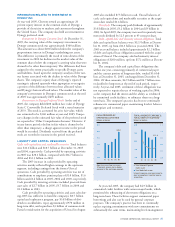
and 2004, respectively. Cash provided by operating activities
in 2005 was $20.1 billion, compared with $14.7 billion in
2004 and $12.3 billion in 2003.
The 2005 increase in cash provided by operating
activities mainly refl ected higher earnings in the upstream
segment, including earnings from the former-Unocal
operations. Cash provided by operating activities was net of
contributions to employee pension plans of $1.0 billion, $1.6
billion and $1.4 billion in 2005, 2004 and 2003, respectively.
Cash provided by investing activities included proceeds from
asset sales of $2.7 billion in 2005, $3.7 billion in 2004 and
$1.1 billion in 2003.
Cash provided by operating activities and asset sales dur-
ing 2005 was suffi cient to fund the company’s $8.7 billion
capital and exploratory program, pay $3.8 billion of divi-
dends to stockholders, repay approximately $970 million in
long-term debt, and repurchase $3 billion of common stock.
Partial consideration for the acquisition of Unocal in August
0.0
25.0
15.0
20.0
10.0
5.0
0201 03 04 05
$20.1
CASH PROVIDED BY
OPERATING ACTIVITIES
Billions of dollars
Operating cash flow increased
37 percent mainly due to higher
earnings in the upstream segment.
9p5.4404
0.0
20.0
15.0
5.0
10.0
0.0
1.5
1.2
0.9
0.6
0.3
TOTAL INTEREST EXPENSE &
TOTAL DEBT AT YEAR-END
Billions of dollars
Total Interest Expense
(right scale)
Total Debt (left scale)
Interest expense rose mainly due to
debt assumptions from the Unocal
acquisition.
$12.9
0201 03 04 05