Chevron 2005 Annual Report Download - page 66
Download and view the complete annual report
Please find page 66 of the 2005 Chevron annual report below. You can navigate through the pages in the report by either clicking on the pages listed below, or by using the keyword search tool below to find specific information within the annual report.-
 1
1 -
2
-
3
-
4
-
5
-
6
-
7
-
8
-
9
-
10
-
11
-
12
-
13
-
14
-
15
-
16
-
17
-
18
-
19
-
20
-
21
-
22
-
23
-
24
-
25
-
26
-
27
-
28
-
29
-
30
-
31
-
32
-
33
-
34
-
35
-
36
-
37
-
38
-
39
-
40
-
41
-
42
-
43
-
44
-
45
-
46
-
47
-
48
-
49
-
50
-
51
-
52
-
53
-
54
-
55
-
 56
56 -
 57
57 -
 58
58 -
 59
59 -
 60
60 -
 61
61 -
 62
62 -
 63
63 -
 64
64 -
 65
65 -
 66
66 -
 67
67 -
 68
68 -
 69
69 -
 70
70 -
 71
71 -
 72
72 -
 73
73 -
 74
74 -
 75
75 -
 76
76 -
77
-
78
-
79
-
80
-
81
-
82
-
83
-
84
-
85
-
86
-
87
-
88
-
89
-
90
-
91
-
92
-
93
-
94
-
95
-
96
-
97
-
98
-
99
-
100
-
101
-
102
-
103
-
104
-
105
-
106
-
107
-
108
 |
 |

64 CHEVRON CORPORATION 2005 ANNUAL REPORT
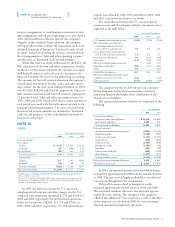
Long-term debt of $7,424 and $5,815 had estimated
fair values of $7,945 and $6,444 at December 31, 2005 and
2004, respectively.
For interest rate swaps, the notional principal amounts
of $1,400 and $1,665 had estimated fair values of $(10) and
$36 at December 31, 2005 and 2004, respectively.
The company holds cash equivalents and U.S. dollar
marketable securities in domestic and offshore portfolios.
Eurodollar bonds, fl oating-rate notes, time deposits and
commercial paper are the primary instruments held. Cash
equivalents and marketable securities had fair values of $8,995
and $8,789 at Decem ber 31, 2005 and 2004, respectively. Of
these balances, $7,894 and $7,338 at the respective year-ends
were classifi ed as cash equiv alents that had average maturities
under 90 days. The remainder, classifi ed as marketable securi-
ties, had average maturities of approximately 2 years.
For the fi nancial and derivative instruments discussed
above, there was not a material change in market risk from
that presented in 2004.
Concentrations of Credit Risk The company’s fi nancial
instruments that are exposed to concentrations of credit risk
consist primarily of its cash equivalents, marketable securi-
ties, derivative fi nancial instruments and trade receivables.
The company’s short-term investments are placed with a wide
array of fi nancial institutions with high credit ratings. This
diversifi ed investment policy limits the company’s exposure
both to credit risk and to concentrations of credit risk. Similar
standards of diversity and creditworthiness are applied to the
company’s counterparties in derivative instruments.
The trade receivable balances, refl ecting the company’s
diver sifi ed sources of revenue, are dispersed among the
company’s broad customer base worldwide. As a consequence,
concentrations of credit risk are limited. The company
routinely assesses the fi nancial strength of its customers.
When the fi nancial strength of a customer is not considered
sufficient, requiring Letters of Credit is a principal method
used to support sales to customers.
Investment in Dynegy Preferred Stock At December 31, 2005,
the company held an investment in $400 face value of
Dynegy Series C Convertible Preferred Stock, with a stated
maturity date of 2033. The stock was recorded at its fair
value, which was estimated to be $360 at the end of 2005.
Temporary changes in the estimated fair value of
the preferred stock are reported in “Other comprehensive
income.” However, if any future decline in fair value is
deemed to be other than temporary, a charge against income
in the period would be recorded. Dividends payable on the
preferred stock are recognized in income each period.
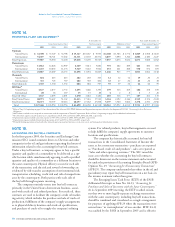
NOTE 8.
OPERATING SEGMENTS AND GEOGRAPHIC DATA
Although each subsidiary of Chevron is responsible for its
own affairs, Chevron Corporation manages its investments
in these subsidiaries and their affi liates. For this purpose,
the investments are grouped as follows: upstream – explora-
tion and production; downstream – refi ning, marketing and
transportation; chemicals; and all other. The fi rst three of
these groupings represent the company’s “reportable segments”
and “operating segments” as defi ned in FAS 131, “Disclosures
About Segments of an Enterprise and Related Information.”
The segments are separately managed for investment
purposes under a structure that includes “segment managers”
who report to the company’s “chief operating decision maker”
(CODM) (terms as defi ned in FAS 131). The CODM is
the company’s Executive Committee, a committee of senior
offi cers that includes the Chief Executive Offi cer and that, in
turn, reports to the Board of Directors of Chevron Corporation.
The operating segments represent components of the
company as described in FAS 131 terms that engage in activi-
ties (a) from which revenues are earned and expenses are
incurred; (b) whose operating results are regularly reviewed
by the CODM, which makes decisions about resources to be
allocated to the segments and to assess their performance;
and (c) for which discrete fi nancial information is available.
Segment managers for the reportable segments are directly
accountable to and maintain regular contact with the compa-
ny’s CODM to discuss the segment’s operating activities and
fi nancial performance. The CODM approves annual capital
and exploratory budgets at the reportable segment level, as well
as reviews capital and exploratory funding for major projects
and approves major changes to the annual capital and explor-
atory budgets. However, business-unit managers within the
operating segments are directly responsible for decisions relat-
ing to project implementation and all other matters connected
with daily operations. Company offi cers who are members of
the Executive Committee also have individual management
responsibilities and participate in other committees for pur-
poses other than acting as the CODM.
“All Other” activities include the company’s interest in
Dynegy, mining operations of coal and other minerals, power
generation businesses, worldwide cash management and debt
fi nancing activities, corporate administrative functions, insur-
ance operations, real estate activities, and technology companies.
The company’s primary country of operation is the
United States of America, its country of domicile. Other
components of the company’s operations are reported as
“International” (outside the United States).
Segment Earnings The company evaluates the performance of
its operating segments on an after-tax basis, without consider-
ing the effects of debt fi nancing interest expense or investment
interest income, both of which are managed by the company
on a worldwide basis. Corporate administrative costs and
assets are not allocated to the operating segments. However,
operating segments are billed for the direct use of corporate
services. Nonbillable costs remain at the corporate level in
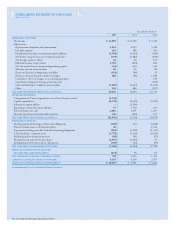
Notes to the Consolidated Financial Statements
Millions of dollars, except per-share amounts
NOTE 7. FINANCIAL AND DERIVATIVE
INSTRUMENTS – Continued