Chevron 2005 Annual Report Download - page 29
Download and view the complete annual report
Please find page 29 of the 2005 Chevron annual report below. You can navigate through the pages in the report by either clicking on the pages listed below, or by using the keyword search tool below to find specific information within the annual report.-
 1
1 -
2
-
3
-
4
-
5
-
6
-
7
-
8
-
9
-
10
-
11
-
12
-
13
-
14
-
15
-
16
-
17
-
18
-
 19
19 -
 20
20 -
 21
21 -
 22
22 -
 23
23 -
 24
24 -
 25
25 -
 26
26 -
 27
27 -
 28
28 -
 29
29 -
 30
30 -
 31
31 -
 32
32 -
 33
33 -
 34
34 -
 35
35 -
 36
36 -
 37
37 -
 38
38 -
 39
39 -
40
-
41
-
42
-
43
-
44
-
45
-
46
-
47
-
48
-
49
-
50
-
51
-
52
-
53
-
54
-
55
-
56
-
57
-
58
-
59
-
60
-
61
-
62
-
63
-
64
-
65
-
66
-
67
-
68
-
69
-
70
-
71
-
72
-
73
-
74
-
75
-
76
-
77
-
78
-
79
-
80
-
81
-
82
-
83
-
84
-
85
-
86
-
87
-
88
-
89
-
90
-
91
-
92
-
93
-
94
-
95
-
96
-
97
-
98
-
99
-
100
-
101
-
102
-
103
-
104
-
105
-
106
-
107
-
108
 |
 |

CHEVRON CORPORATION 2005 ANNUAL REPORT 27
ny’s production capacity in an affected region. The company
monitors developments closely in the countries in which it
operates and holds investments, and attempts to manage risks
in operating its facilities and business.
Price levels for capitalized costs and operating expenses
associated with the effi cient production of crude oil and
natural gas can also be subject to external factors beyond the
company’s control. External factors include not only the gen-
eral level of infl ation but also prices charged by the industry’s
product- and service-providers, which can be affected by the
volatility of the industry’s own supply and demand condi-
tions for such products and services. The oil and gas industry
worldwide experienced signifi cant price increases for these
items during 2005 that are expected to continue into 2006.
Capitalized costs and operating expenses can also be affected
by uninsured damages to production facilities caused by
severe weather or civil unrest.
Industry price levels for crude oil continued an upward
trend in 2005. The spot price for West Texas Intermediate
(WTI) crude oil, one of the benchmark crudes, averaged $57
per barrel in 2005, an increase of approximately $16 per bar-
rel from the 2004 average price. The WTI spot price for the
fi rst two months of 2006 averaged about $64 per barrel. The
rise in crude oil prices refl ects, among other things, increas-
ing demand in growing economies, the heightened level
of geopolitical uncertainty in some areas of the world and
supply concerns in other key producing regions, including
production in the Gulf of Mexico that partially was shut in
following the hurricanes.
As was the case in 2004, the differential in prices
between high-quality, light-sweet crude oils, such as the U.S.
benchmark WTI, and heavier crudes was unusually wide in
2005. Chevron produces heavy crude oil in California, Chad,
Indonesia, the Partitioned Neutral Zone (between Saudi
Arabia and Kuwait), Venezuela (including volumes produced
under an operating service agreement) and certain fi elds in
Angola, China and the United Kingdom North Sea. The
price for the heavier crudes has been dampened because of
ample supply, together with lower relative demand from the
number of refi neries that are able to process this lower-qual-
ity feedstock into light-product fuels (i.e., motor gasoline, jet
fuel, aviation gasoline and diesel fuel). The demand for heavy
crude was further reduced in late 2005 as refi ning capacity
along the U.S. Gulf Coast was interrupted by hurricanes.
The price for higher-quality light oil, on the other hand, has
remained high, as the demand for light products, which can
be manufactured by any refi nery from light oil, has been
robust worldwide.
Natural gas prices, particularly in the United States, also
trended upward in 2005. For the full year, U.S. benchmark
prices at Henry Hub averaged about $8 per thousand cubic
feet (MCF), compared with about $6 in 2004. Henry Hub
spot prices peaked in December 2005 above $14, as supplies
early in the winter heating season were reduced by produc-
tion shut in following Hurricanes Katrina and Rita. By
mid-February 2006, prices had moved downward to about
$8 per MCF. Fluctuations in the price for natural gas in the
United States are closely associated with the volumes pro-
duced in North America and the inventory in underground
storage to meet customer demand.
In contrast to the United States, certain other regions of
the world in which the company operates have different sup-
ply, demand and regulatory circumstances, typically resulting
in signifi cantly lower average sales prices for the company’s
production of natural gas. (Refer to page 36 for the compa-
ny’s average natural gas prices for the U.S. and international
regions.) Additionally, excess supply conditions that exist
in certain parts of the world cannot easily serve to mitigate
the relatively high-price conditions in the United States and
other markets because of lack of infrastructure and the dif-
fi culties in transporting natural gas. To help address this
regional imbalance between supply and demand for natural
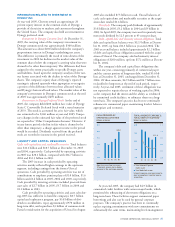
CRUDE OIL PRICES 1986 THROUGH 2005
Dollars per barrel
86 8887 89 90 91 92 93 94 95 96 97 98 99 00 01 0402 03 05
$60.06
10
60
50
40
30
20
The average spot price of West Texas Intermediate, a benchmark crude oil, rose
24 percent from the fourth quarter of 2004 to the fourth quarter of 2005.
0
3000
2400
600
1200
1800
0.00
8.00
6.00
4.00
2.00
U.S. NATURAL GAS PRICES
& NET PRODUCTION
Prices in Dollars per Thousand
Cubic Feet (right scale)
Production in Millions of
Cubic Feet per Day (left scale)
Average prices increased 35 percent
during 2005. Production was down
13 percent mainly due to the effects
of storms in the U.S. Gulf of Mexico,
asset sales and natural field declines
partially offset by the addition of
Unocal production.
0201 03 04 05
$7.43
1,634
0
2500
2000
1500
1000
500
0201 03 04 05
1,669
NET CRUDE OIL &
NATURAL GAS
LIQUIDS PRODUCTION*
Thousands of barrels per day
United States
International
Net liquids production declined
about 2 percent in 2005, mainly
due to the effects of storms, asset
sales and natural field declines
partially offset by the addition of
Unocal production.
*Includes equity in affiliates