Chevron 2005 Annual Report Download - page 36
Download and view the complete annual report
Please find page 36 of the 2005 Chevron annual report below. You can navigate through the pages in the report by either clicking on the pages listed below, or by using the keyword search tool below to find specific information within the annual report.-
 1
1 -
2
-
3
-
4
-
5
-
6
-
7
-
8
-
9
-
10
-
11
-
12
-
13
-
14
-
15
-
16
-
17
-
18
-
19
-
20
-
21
-
22
-
23
-
24
-
25
-
 26
26 -
 27
27 -
 28
28 -
 29
29 -
 30
30 -
 31
31 -
 32
32 -
 33
33 -
 34
34 -
 35
35 -
 36
36 -
 37
37 -
 38
38 -
 39
39 -
 40
40 -
 41
41 -
 42
42 -
 43
43 -
 44
44 -
 45
45 -
 46
46 -
47
-
48
-
49
-
50
-
51
-
52
-
53
-
54
-
55
-
56
-
57
-
58
-
59
-
60
-
61
-
62
-
63
-
64
-
65
-
66
-
67
-
68
-
69
-
70
-
71
-
72
-
73
-
74
-
75
-
76
-
77
-
78
-
79
-
80
-
81
-
82
-
83
-
84
-
85
-
86
-
87
-
88
-
89
-
90
-
91
-
92
-
93
-
94
-
95
-
96
-
97
-
98
-
99
-
100
-
101
-
102
-
103
-
104
-
105
-
106
-
107
-
108
 |
 |

MANAGEMENT’S DISCUSSION AND ANALYSIS OF
FINANCIAL CONDITION AND RESULTS OF OPERATIONS
34 CHEVRON CORPORATION 2005 ANNUAL REPORT
in income from 2003
to 2004 refl ected sig-
nifi cantly higher average
refi ned-product margins
in most of the company’s
operating areas and higher
earnings from interna-
tional shipping operations.
Earnings in 2003 also
included special-item
charges (discussed below)
and foreign currency
losses that totaled more
than $300 million.
Tota l internationa l
refi ned products sales
volumes were 2.3 million
barrels per day in 2005,
about 4 percent lower than
2004. The sales decline
was primarily the result
of lower gasoline trading
activity and lower fuel-oil
sales. Refi ned product
sales volume of 2.4 million
barrels per day in 2004 was about 4 percent higher than 2.3
million in 2003. Refer to the “Selected Operating Data” table,
on page 36, for the three-year comparative refi ned-product
sales volumes in the international areas.
The special-item charges of $189 million in 2003
included the write-down of the Batangas Refi nery in the
Philippines in advance of its conversion to a product terminal
facility, employee severance costs associated with the global
downstream restructuring and reorganization, the recogni-
tion of the impairment of certain assets in anticipation of
their sale and the company’s share of losses from an asset sale
and asset impairment by an equity affi liate.
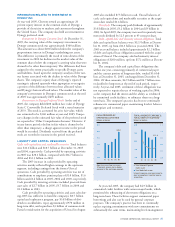
Chemicals
Millions of dollars 2005 2004 2003
Segment Income* $ 298 $ 314 $ 69
*Includes Foreign Currency Effects: $ – $ (3) $ 13
The chemicals seg-
ment includes the company’s
Oronite subsidiary and
the company’s 50 percent
share of its equity invest-
ment in Chevron Phillips
Chemical Company LLC
(CPChem). In 2005, results
for the company’s Oronite
subsidiary were down due
to signifi cantly higher costs
for feedstocks and adverse
effects from the shut-down
of operations in the U.S.
Gulf Coast due to hurri-
canes. Earnings in 2005 for
CPChem were higher than
2004 on improved margins
for commodity chemicals.
Results for both businesses in
2005 were dampened by the effects of the U.S. hurricanes.
Signifi cantly lower earnings in 2003 refl ected weak demand
for commodity chemicals and industry oversupply conditions
in the period.
All Other
Millions of dollars 2005 2004 2003
Charges Before Cumulative Effect of
Changes in Accounting Principles $ (689) $ (20) $ (213)
Cumulative Effect of Accounting
Changes – – 9
Net Charges1,2 $ (689) $ (20) $ (204)
1 Includes Foreign Currency Effects: $ (51) $ 44 $ 43
2 Includes Special-Item Gains (Charges):
Dynegy-Related $ – $ – $ 325
Asset Impairments/Write-offs – – (84)
Restructuring and Reorganizations – – (16)
Total $ – $ – $ 225
All Other consists of the company’s interest in Dynegy,
mining operations of coal and other minerals, power gen-
eration businesses, worldwide cash management and debt
fi nancing activities, corporate administrative functions,
insurance operations, real estate activities and technology
companies.
The net charges of $689 million in 2005 increased sig-
nifi cantly from $20 million in 2004. Approximately $400
million of the change related to larger benefi ts in 2004 from
-150
-50
-100
350
100
50
0
200
150
250
300
0201 03 04 05
$298
WORLDWIDE CHEMICALS
EARNINGS*
Millions of dollars
Chemicals earnings declined about
5 percent from 2004 mainly due
to the effects of storms.
*Includes equity in affiliates
0
2800
2100
1400
700
0201 03 04 05
2,295
INTERNATIONAL GASOLINE &
OTHER REFINED PRODUCTS
SALES*
Thousands of barrels per day
Refined products sales volumes
decreased about 4 percent from
2004.
*Includes equity in affiliates
Gasoline
Jet Fuel
Gas Oils & Kerosene
Residual Fuel Oil
Other