Chevron 2005 Annual Report Download - page 94
Download and view the complete annual report
Please find page 94 of the 2005 Chevron annual report below. You can navigate through the pages in the report by either clicking on the pages listed below, or by using the keyword search tool below to find specific information within the annual report.-
 1
1 -
2
-
3
-
4
-
5
-
6
-
7
-
8
-
9
-
10
-
11
-
12
-
13
-
14
-
15
-
16
-
17
-
18
-
19
-
20
-
21
-
22
-
23
-
24
-
25
-
26
-
27
-
28
-
29
-
30
-
31
-
32
-
33
-
34
-
35
-
36
-
37
-
38
-
39
-
40
-
41
-
42
-
43
-
44
-
45
-
46
-
47
-
48
-
49
-
50
-
51
-
52
-
53
-
54
-
55
-
56
-
57
-
58
-
59
-
60
-
61
-
62
-
63
-
64
-
65
-
66
-
67
-
68
-
69
-
70
-
71
-
72
-
73
-
74
-
75
-
76
-
77
-
78
-
79
-
80
-
81
-
82
-
83
-
 84
84 -
 85
85 -
 86
86 -
 87
87 -
 88
88 -
 89
89 -
 90
90 -
 91
91 -
 92
92 -
 93
93 -
 94
94 -
 95
95 -
 96
96 -
 97
97 -
 98
98 -
 99
99 -
 100
100 -
 101
101 -
 102
102 -
 103
103 -
 104
104 -
105
-
106
-
107
-
108
 |
 |

92 CHEVRON CORPORATION 2005 ANNUAL REPORT
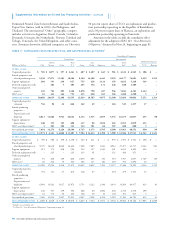
TABLE III – RESULTS OF OPERATIONS FOR OIL AND GAS PRODUCING ACTIVITIES1
The company’s results of operations from oil and gas
producing activities for the years 2005, 2004 and 2003 are
shown in the following table. Net income from exploration
and production activities as reported on page 65 refl ects
income taxes computed on an effective rate basis.
In accordance with FAS 69, income taxes in Table III are
based on statutory tax rates, refl ecting allowable deductions
and tax credits. Interest income and expense are excluded
from the results reported in Table III and from the net
income amounts on page 65.
Consolidated Companies
United States International
Gulf of Total Asia- Total
Affi liated Companies
Millions of dollars Calif. Mexico Other U.S. Africa Pacifi c Indonesia Other Int’l. Total TCO Hamaca
YEAR ENDED DEC. 31, 2005
Revenues from net
production
Sales $ 337 $ 1,576 $ 3,174 $ 5,087 $ 2,142 $ 2,941 $ 539 $ 2,668 $ 8,290 $ 13,377 $ 2,307 $ 666
Transfers 3,497 2,127 1,395 7,019 3,615 3,179 1,986 2,607 11,387 18,406 – –
Total 3,834 3,703 4,569 12,106 5,757 6,120 2,525 5,275 19,677 31,783 2,307 666
Production expenses
excluding taxes (916) (638) (777) (2,331) (558) (570) (660) (596) (2,384) (4,715) (152) (82)
Taxes other than on
income (65) (41) (384) (490) (48) (189) (1) (195) (433) (923) (27) –
Proved producing
properties: Depreciation
and depletion (253) (936) (520) (1,709) (414) (852) (550) (672) (2,488) (4,197) (83) (46)
Accretion expense2 (13) (35) (46) (94) (22) (20) (15) (25) (82) (176) (1) –
Exploration expenses – (307) (13) (320) (117) (90) (26) (190) (423) (743) – –
Unproved properties
valuation (3) (32) (4) (39) (50) (8) – (24) (82) (121) – –
Other income (expense)3 2 (354) (140) (492) (243) (182) 182 280 37 (455) (9) 8
Results before
income taxes 2,586 1,360 2,685 6,631 4,305 4,209 1,455 3,853 13,822 20,453 2,035 546
Income tax expense (913) (482) (953) (2,348) (3,430) (2,264) (644) (1,938) (8,276) (10,624) (611) (186)
RESULTS OF PRODUCING
OPERATIONS $ 1,673 $ 878 $ 1,732 $ 4,283 $ 875 $ 1,945 $ 811 $ 1,915 $ 5,546 $ 9,829 $ 1,424 $ 360
YEAR ENDED DEC. 31, 2004
Revenues from net
production
Sales $ 251 $ 1,925 $ 2,163 $ 4,339 $ 1,321 $ 1,191 $ 256 $ 2,481 $ 5,249 $ 9,588 $ 1,619 $ 205
Transfers 2,651 1,768 1,224 5,643 2,645 2,265 1,613 1,903 8,426 14,069 – –
Total 2,902 3,693 3,387 9,982 3,966 3,456 1,869 4,384 13,675 23,657 1,619 205
Production expenses
excluding taxes (710) (547) (697) (1,954) (574) (431) (591) (544) (2,140) (4,094) (143) (53)
Taxes other than on
income (57) (45) (321) (423) (24) (138) (1) (134) (297) (720) (26) –
Proved producing
properties: Depreciation
and depletion (232) (774) (384) (1,390) (367) (401) (393) (798) (1,959) (3,349) (104) (4)
Accretion expense2 (12) (25) (19) (56) (22) (8) (13) 11 (32) (88) (2) –
Exploration expenses – (227) (6) (233) (235) (69) (17) (144) (465) (698) – –
Unproved properties
valuation (3) (29) (4) (36) (23) (8) – (25) (56) (92) – –
Other income (expense)3 14 24 474 512 49 10 12 1,028 1,099 1,611 (7) (58)
Results before
income taxes 1,902 2,070 2,430 6,402 2,770 2,411 866 3,778 9,825 16,227 1,337 90
Income tax expense (703) (765) (898) (2,366) (2,036) (1,395) (371) (1,759) (5,561) (7,927) (401) –
RESULTS OF PRODUCING
OPERATIONS $ 1,199 $ 1,305 $ 1,532 $ 4,036 $ 734 $ 1,016 $ 495 $ 2,019 $ 4,264 $ 8,300 $ 936 $ 90
1 The value of owned production consumed on lease as fuel has been eliminated from revenues and production expenses, and the related volumes have been deducted from net production in cal-
culating the unit average sales price and production cost. This has no effect on the results of producing operations.
2 Represents accretion of ARO liability. Refer to Note 24, “Asset Retirement Obligations,” beginning on page 83.
3 Includes net sulfur income, foreign currency transaction gains and losses, certain signifi cant impairment write-downs in 2004 and 2003, miscellaneous expenses, etc. Also includes net income
from related oil and gas activities that do not have oil and gas reserves attributed to them (for example, net income from technical and operating service agreements) and items identifi ed in the
Management’s Discussion and Analysis on pages 31 through 35. Does not include results for LNG-related activities.
Supplemental Information on Oil and Gas Producing Activities – Continued