Chevron 2005 Annual Report Download - page 89
Download and view the complete annual report
Please find page 89 of the 2005 Chevron annual report below. You can navigate through the pages in the report by either clicking on the pages listed below, or by using the keyword search tool below to find specific information within the annual report.-
 1
1 -
2
-
3
-
4
-
5
-
6
-
7
-
8
-
9
-
10
-
11
-
12
-
13
-
14
-
15
-
16
-
17
-
18
-
19
-
20
-
21
-
22
-
23
-
24
-
25
-
26
-
27
-
28
-
29
-
30
-
31
-
32
-
33
-
34
-
35
-
36
-
37
-
38
-
39
-
40
-
41
-
42
-
43
-
44
-
45
-
46
-
47
-
48
-
49
-
50
-
51
-
52
-
53
-
54
-
55
-
56
-
57
-
58
-
59
-
60
-
61
-
62
-
63
-
64
-
65
-
66
-
67
-
68
-
69
-
70
-
71
-
72
-
73
-
74
-
75
-
76
-
77
-
78
-
 79
79 -
 80
80 -
 81
81 -
 82
82 -
 83
83 -
 84
84 -
 85
85 -
 86
86 -
 87
87 -
 88
88 -
 89
89 -
 90
90 -
 91
91 -
 92
92 -
 93
93 -
 94
94 -
 95
95 -
 96
96 -
 97
97 -
 98
98 -
 99
99 -
100
-
101
-
102
-
103
-
104
-
105
-
106
-
107
-
108
 |
 |

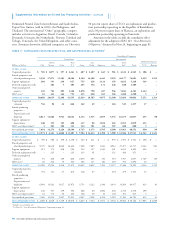
CHEVRON CORPORATION 2005 ANNUAL REPORT 87
Worldwide – Includes Equity in Affi liates
Thousands of barrels per day, except natural gas data,
which is millions of cubic feet per day 2005 2004 2003 2002 2001
UNITED STATES
Gross production of crude oil and natural gas liquids 499 555 619 665 670
Net production of crude oil and natural gas liquids 455 505 562 602 614
Gross production of natural gas 1,860 2,191 2,619 2,945 3,167
Net production of natural gas2 1,634 1,873 2,228 2,405 2,706
Net production of oil equivalents 727 817 933 1,003 1,065
Refi nery input3 846 914 951 979 1,336
Sales of refi ned products3 1,473 1,506 1,436 1,600 2,500
Sales of natural gas liquids 151 177 194 241 185
Total sales of petroleum products 1,624 1,683 1,630 1,841 2,685
Sales of natural gas 5,449 4,518 4,304 5,891 8,191
INTERNATIONAL
Gross production of crude oil and natural gas liquids 1,676 1,645 1,681 1,765 1,852
Net production of crude oil and natural gas liquids 1,214 1,205 1,246 1,295 1,345
Other produced volumes 143 140 114 97 105
Gross production of natural gas 2,726 2,203 2,203 2,120 1,949
Net production of natural gas2 2,599 2,085 2,064 1,971 1,711
Net production of oil equivalents 1,790 1,692 1,704 1,720 1,735
Refi nery input 1,038 1,044 1,040 1,100 1,136
Sales of refi ned products 2,295 2,402 2,302 2,175 2,454
Sales of natural gas liquids 108 105 107 131 115
Total sales of petroleum products 2,403 2,507 2,409 2,306 2,569
Sales of natural gas 2,289 1,885 1,951 3,131 2,675
TOTAL WORLDWIDE
Gross production of crude oil and natural gas liquids 2,175 2,200 2,300 2,430 2,522
Net production of crude oil and natural gas liquids 1,669 1,710 1,808 1,897 1,959
Other produced volumes 143 140 114 97 105
Gross production of natural gas 4,586 4,394 4,822 5,065 5,116
Net production of natural gas2 4,233 3,958 4,292 4,376 4,417
Net production of oil equivalents 2,517 2,509 2,637 2,723 2,800
Refi nery input3 1,884 1,958 1,991 2,079 2,472
Sales of refi ned products3 3,768 3,908 3,738 3,775 4,954
Sales of natural gas liquids 259 282 301 372 300
Total sales of petroleum products 4,027 4,190 4,039 4,147 5,254
Sales of natural gas 7,738 6,403 6,255 9,022 10,866
Worldwide – Excludes Equity in Affi liates
Number of wells completed (net)4
Oil and gas 1,396 1,307 1,472 1,349 1,698
Dry 26 24 36 49 75
Productive oil and gas wells (net)4 52,733 44,707 48,155 50,320 47,388
1 Gross production represents the company’s share of total production before deducting lessors’ royalties. Net production is gross production minus royalties paid to lessors.
2 Includes natural gas consumed on lease:
United States 48 50 65 64 64
International 332 293 268 256 262
Total 380 343 333 320 326
3 2001 includes sales volumes and refi nery inputs of units sold as a condition of the Texaco merger.
4 Net wells include wholly owned and the sum of fractional interests in partially owned wells.
FIVE-YEAR OPERATING SUMMARY1
Unaudited