Chevron 2005 Annual Report Download - page 91
Download and view the complete annual report
Please find page 91 of the 2005 Chevron annual report below. You can navigate through the pages in the report by either clicking on the pages listed below, or by using the keyword search tool below to find specific information within the annual report.-
 1
1 -
2
-
3
-
4
-
5
-
6
-
7
-
8
-
9
-
10
-
11
-
12
-
13
-
14
-
15
-
16
-
17
-
18
-
19
-
20
-
21
-
22
-
23
-
24
-
25
-
26
-
27
-
28
-
29
-
30
-
31
-
32
-
33
-
34
-
35
-
36
-
37
-
38
-
39
-
40
-
41
-
42
-
43
-
44
-
45
-
46
-
47
-
48
-
49
-
50
-
51
-
52
-
53
-
54
-
55
-
56
-
57
-
58
-
59
-
60
-
61
-
62
-
63
-
64
-
65
-
66
-
67
-
68
-
69
-
70
-
71
-
72
-
73
-
74
-
75
-
76
-
77
-
78
-
79
-
80
-
 81
81 -
 82
82 -
 83
83 -
 84
84 -
 85
85 -
 86
86 -
 87
87 -
 88
88 -
 89
89 -
 90
90 -
 91
91 -
 92
92 -
 93
93 -
 94
94 -
 95
95 -
 96
96 -
 97
97 -
 98
98 -
 99
99 -
 100
100 -
 101
101 -
102
-
103
-
104
-
105
-
106
-
107
-
108
 |
 |

CHEVRON CORPORATION 2005 ANNUAL REPORT 89
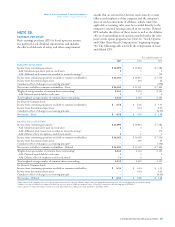
SUPPLEMENTAL INFORMATION ON OIL AND GAS PRODUCING ACTIVITIES
Unaudited
In accordance with Statement of FAS 69, “Disclosures About
Oil and Gas Producing Activities,” this section provides
supplemental information on oil and gas exploration and
producing activities of the company in seven separate tables.
Tables I through IV provide historical cost information per-
taining to costs incurred in exploration, property acquisitions
and development; capitalized costs; and results of operations.
Tables V through VII present information on the company’s
estimated net proved reserve quantities; standardized mea-
sure of estimated discounted future net cash fl ows related to
proved reserves; and changes in estimated discounted future
net cash fl ows. The Africa geographic area includes activities
principally in Nigeria, Angola, Chad, Republic of the Congo
and the Democratic Republic of the Congo. The Asia-Pacifi c
geographic area includes activities principally in Australia,
Azerbaijan, Bangladesh, China, Kazakhstan, Myanmar, the
TABLE I – COSTS INCURRED IN EXPLORATION, PROPERTY ACQUISITIONS AND DEVELOPMENT1
Consolidated Companies
United States International
Gulf of Tot a l A sia- Tota l Affi liated Companies
Millions of dollars Calif. Mexico Other U.S. Africa Pacifi c Indonesia Other Int’l. Total TCO Hamaca
YEAR ENDED DEC. 31, 2005
Exploration
Wells $ – $ 452 $ 24 $ 476 $ 105 $ 38 $ 9 $ 201 $ 353 $ 829 $ – $ –
Geological and geophysical – 67 – 67 96 28 10 68 202 269 – –
Rentals and other – 93 8 101 24 58 12 72 166 267 – –
Total exploration – 612 32 644 225 124 31 341 721 1,365 – –
Property acquisitions
Proved – Unocal2,3 – 1,608 2,388 3,996 30 6,609 637 1,790 9,066 13,062 – –
Proved – Other2 – 6 10 16 2 2 – 12 16 32 – –
Unproved – Unocal – 819 295 1,114 11 2,209 821 38 3,079 4,193 – –
Unproved – Other – 17 6 23 67 – – 28 95 118 – –
Total property acquisitions – 2,450 2,699 5,149 110 8,820 1,458 1,868 12,256 17,405 – –
Development4 494 639 596 1,729 1,871 1,026 325 713 3,935 5,664 767 43
ARO asset 13 41 5 59 21 62 57 13 153 212 – –
TOTAL COSTS INCURRED $ 507 $ 3,742 $ 3,332 $ 7,581 $ 2,227 $ 10,032 $ 1,871 $ 2,935 $ 17,065 $ 24,646 $ 767 $ 43
YEAR ENDED DEC. 31, 2004
Exploration
Wells $ – $ 388 $ – $ 388 $ 116 $ 25 $ 2 $ 127 $ 270 $ 658 $ – $ –
Geological and geophysical – 47 2 49 103 10 12 46 171 220 – –
Rentals and other – 43 3 46 52 47 1 53 153 199 – –
Total exploration – 478 5 483 271 82 15 226 594 1,077 – –
Property acquisitions
Proved2 – 6 1 7 111 16 – 4 131 138 – –
Unproved – 29 – 29 82 – – 5 87 116 – –
Total property acquisitions – 35 1 36 193 16 – 9 218 254 – –
Development4 412 457 372 1,241 1,047 567 245 542 2,401 3,642 896 208
ARO asset 1 9 3 13 10 53 158 85 306 319 – –
TOTAL COSTS INCURRED $ 413 $ 979 $ 381 $ 1,773 $ 1,521 $ 718 $ 418 $ 862 $ 3,519 $ 5,292 $ 896 $ 208
YEAR ENDED DEC. 31, 2003
Exploration
Wells $ – $ 415 $ 9 $ 424 $ 116 $ 43 $ 2 $ 72 $ 233 $ 657 $ – $ –
Geological and geophysical – 16 23 39 75 9 5 30 119 158 – –
Rentals and other – 64 (20) 44 12 58 – 46 116 160 – –
Total exploration – 495 12 507 203 110 7 148 468 975 – –
Property acquisitions
Proved2 – 15 3 18 – 20 – 7 27 45 – –
Unproved – 30 3 33 51 6 – 14 71 104 – –
Total property acquisitions – 45 6 51 51 26 – 21 98 149 – –
Development 264 434 350 1,048 974 605 363 461 2,403 3,451 551 199
TOTAL COSTS INCURRED $ 264 $ 974 $ 368 $ 1,606 $ 1,228 $ 741 $ 370 $ 630 $ 2,969 $ 4,575 $ 551 $ 199
1 Includes costs incurred whether capitalized or expensed. Excludes general support equipment expenditures. See Note 24, “Asset Retirement Obligations,” beginning on page 83.
2 Includes wells, equipment and facilities associated with proved reserves. Does not include properties acquired through property exchanges.
3 Included in proved property acquisitions for Unocal are $845 of ARO assets, composed of: Gulf of Mexico $115; Other U.S. $271; Africa $9; Asia-Pacifi c $366; Indonesia $25; Other
International $59.
4 Includes $160 and $63 costs incurred prior to assignment of proved reserves in 2005 and 2004, respectively.