Chevron 2005 Annual Report Download - page 41
Download and view the complete annual report
Please find page 41 of the 2005 Chevron annual report below. You can navigate through the pages in the report by either clicking on the pages listed below, or by using the keyword search tool below to find specific information within the annual report.-
 1
1 -
2
-
3
-
4
-
5
-
6
-
7
-
8
-
9
-
10
-
11
-
12
-
13
-
14
-
15
-
16
-
17
-
18
-
19
-
20
-
21
-
22
-
23
-
24
-
25
-
26
-
27
-
28
-
29
-
30
-
 31
31 -
 32
32 -
 33
33 -
 34
34 -
 35
35 -
 36
36 -
 37
37 -
 38
38 -
 39
39 -
 40
40 -
 41
41 -
 42
42 -
 43
43 -
 44
44 -
 45
45 -
 46
46 -
 47
47 -
 48
48 -
 49
49 -
 50
50 -
 51
51 -
52
-
53
-
54
-
55
-
56
-
57
-
58
-
59
-
60
-
61
-
62
-
63
-
64
-
65
-
66
-
67
-
68
-
69
-
70
-
71
-
72
-
73
-
74
-
75
-
76
-
77
-
78
-
79
-
80
-
81
-
82
-
83
-
84
-
85
-
86
-
87
-
88
-
89
-
90
-
91
-
92
-
93
-
94
-
95
-
96
-
97
-
98
-
99
-
100
-
101
-
102
-
103
-
104
-
105
-
106
-
107
-
108
 |
 |

CHEVRON CORPORATION 2005 ANNUAL REPORT 39
and 2003, expenditures were $8.3 billion and $7.4 billion,
respectively, including the company’s share of affi liates’
expenditures of $1.6 billion and $1.1 billion in the corre-
sponding periods.
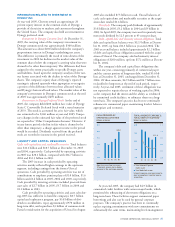
Of the $11.1 billion in expenditures for 2005, about
three-fourths, or $8.4 billion, related to upstream activities.
Approximately the same percentage was also expended for
upstream operations in
2004 and 2003. Interna-
tional upstream accounted
for about 70 percent of
the worldwide upstream
investment in each of
the years, refl ecting the
company’s continuing
focus on opportunities
that are available outside
the United States.
In 2006, the com-
pany estimates capital and
exploratory expenditures
will be 33 percent higher
at $14.8 billion, includ-
ing spending by affi liates.
About three-fourths, or
$11.3 billion, is again for
exploration and produc-
tion activities, with $8
billion of that amount
outside the United States.
Spending is primarily
targeted for exploratory prospects in the deepwater Gulf of
Mexico and western Africa and major development projects
in Angola, Nigeria, Kazakhstan and the deepwater Gulf of
Mexico. Included in the upstream expenditures is about $1
billion to develop the company’s international natural gas
resource base.
Worldwide downstream spending in 2006 is estimated
at $2.8 billion, with about $1.9 billion for refi ning and
marketing and $900 million for supply and transportation
projects, including pipelines to support expanded upstream
production. Approximately two-thirds of the total projected
spending is outside the United States.
Investments in chemicals businesses in 2006 are bud-
geted at $250 million. Estimates for energy technology,
information technology and facilities, real estate activities,
power-related businesses, and other businesses total approxi-
mately $460 million.
Pension Obligations In 2005, the company’s pension
plan contributions totaled approximately $1 billion, includ-
ing nearly $200 million to the Unocal plans. Approximately
$800 million of the total was contributed to U.S. plans. In
2006, the company estimates contributions will be $500 mil-
lion. Actual amounts are dependent upon plan-investment
results, changes in pension obligations, regulatory environ-
ments and other economic factors. Additional funding may
be required if investment returns are insuffi cient to offset
increases in plan obligations. Refer also to the discussion of
pension accounting in “Critical Accounting Estimates and
Assumptions,” beginning on page 46.
FINANCIAL RATIOS
Financial Ratios
At December 31
2005 2004 2003
Current Ratio 1.4 1.5 1.2
Interest Coverage Ratio 47.5 47.6 24.3
Total Debt/Total Debt-Plus-Equity 17.0% 19.9% 25.8%
Current Ratio – current assets divided by current liabili-
ties. The current ratio in all periods was adversely affected
by the fact that Chevron’s inventories are valued on a LIFO
basis. At year-end 2005, the book value of inventory was
lower than replacement costs, based on average acquisition
costs during the year, by approximately $4.8 billion.
Interest Coverage Ratio – income before income tax
expense, plus interest and debt expense and amortization of
capitalized interest, divided by before-tax interest costs. The
company’s interest coverage ratio was essentially unchanged
between 2004 and 2005. The interest coverage ratio was
higher in 2004 compared with 2003, primarily due to higher
before-tax income and lower average debt balances.
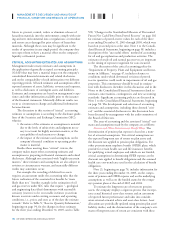
Debt Ratio – total debt
as a percentage of total debt
plus equity. Although total
debt was higher at the end of
2005 than a year earlier, the
debt ratio declined as a result
of higher stockholders’ equity
balances for retained earn-
ings and the capital stock
that was issued in connection
with the Unocal acquisition.
The decline in the debt ratio
between 2003 and 2004 was
primarily due to lower debt
levels and higher retained
earnings.
0.0
10.0
5.0
7.5
2.5
0201 03 04 05
$8.4
EXPLORATION & PRODUCTION —
CAPITAL & EXPLORATORY
EXPENDITURES*
Billions of dollars
United States
International
Exploration and production projects
accounted for 76 percent of total
capital and exploratory expenditures
in 2005.
* Includes equity in affiliates
0.0
80.0
20.0
60.0
40.0
0
50
40
30
20
10
TOTAL DEBT TO TOTAL
DEBT-PLUS-EQUITY RATIO
Billions of dollars/Percent
Debt (left scale)
Stockholders’ Equity (left scale)
Ratio (right scale)
Chevron’s ratio of total debt to total
debt-plus-equity fell to 17 percent at
year-end as the company’s stock-
holders’ equity climbed.
0201 03 04 05
$75.5