Chevron 2005 Annual Report Download - page 67
Download and view the complete annual report
Please find page 67 of the 2005 Chevron annual report below. You can navigate through the pages in the report by either clicking on the pages listed below, or by using the keyword search tool below to find specific information within the annual report.-
 1
1 -
2
-
3
-
4
-
5
-
6
-
7
-
8
-
9
-
10
-
11
-
12
-
13
-
14
-
15
-
16
-
17
-
18
-
19
-
20
-
21
-
22
-
23
-
24
-
25
-
26
-
27
-
28
-
29
-
30
-
31
-
32
-
33
-
34
-
35
-
36
-
37
-
38
-
39
-
40
-
41
-
42
-
43
-
44
-
45
-
46
-
47
-
48
-
49
-
50
-
51
-
52
-
53
-
54
-
55
-
56
-
 57
57 -
 58
58 -
 59
59 -
 60
60 -
 61
61 -
 62
62 -
 63
63 -
 64
64 -
 65
65 -
 66
66 -
 67
67 -
 68
68 -
 69
69 -
 70
70 -
 71
71 -
 72
72 -
 73
73 -
 74
74 -
 75
75 -
 76
76 -
 77
77 -
78
-
79
-
80
-
81
-
82
-
83
-
84
-
85
-
86
-
87
-
88
-
89
-
90
-
91
-
92
-
93
-
94
-
95
-
96
-
97
-
98
-
99
-
100
-
101
-
102
-
103
-
104
-
105
-
106
-
107
-
108
 |
 |

CHEVRON CORPORATION 2005 ANNUAL REPORT 65
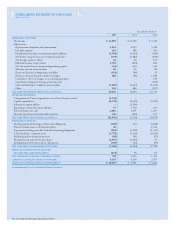
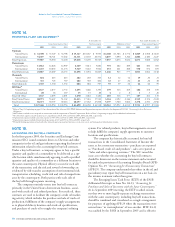
NOTE 8. OPERATING SEGMENTS AND
GEOGRAPHIC DATA – Continued
“All Other.” After-tax segment income (loss) from continuing
operations is presented in the following table:
Year ended December 31
2005 2004 2003
Income From Continuing Operations
Upstream – Exploration and
Production
United States $ 4,168 $ 3,868 $ 3,160
International 7,556 5,622 3,199
Total Upstream 11,724 9,490 6,359
Downstream – Refi ning, Marketing
and Transportation
United States 980 1,261 482
International 1,786 1,989 685
Total Downstream 2,766 3,250 1,167
Chemicals
United States 240 251 5
International 58 63 64
Total Chemicals 298 314 69
Total Segment Income 14,788 13,054 7,595
All Other
Interest expense (337) (257) (352)
Interest income 266 129 75
Other (618) 108 64
Income From Continuing Operations 14,099 13,034 7,382
Income From Discontinued Operations – 294 44
Cumulative effect of changes in
accounting principles – – (196)
Net Income $ 14,099 $ 13,328 $ 7,230
Segment Assets Segment assets do not include intercompany
investments or intercompany receivables. Segment assets at
year-end 2005 and 2004 follow:
At December 31
2005 2004
Upstream – Exploration and Production
United States $ 19,006 $ 11,869
International 46,501 31,239
Goodwill 4,636 –
Total Upstream 70,143 43,108
Downstream – Refi ning, Marketing and
Transportation
United States 12,273 10,091
International 22,294 19,415
Total Downstream 34,567 29,506
Chemicals
United States 2,452 2,316
International 727 667
Total Chemicals 3,179 2,983
Total Segment Assets 107,889 75,597
All Other*
United States 9,234 11,746
International 8,710 5,865
Total All Other 17,944 17,611
Total Assets – United States 42,965 36,022
Total Assets – International 78,232 57,186
Goodwill 4,636 –
Total Assets $ 125,833 $ 93,208
* All Other assets consist primarily of worldwide cash, cash equivalents and marketable
securities, real estate, information systems, the company’s investment in Dynegy, mining
operations of coal and other minerals, power generation businesses, technology compa-
nies, and assets of the corporate administrative functions.
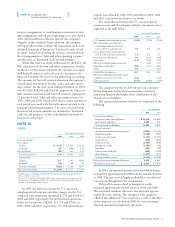
Segment Sales and Other Operating Revenues Operating seg-
ment sales and other operating revenues, including internal
transfers, for the years 2005, 2004 and 2003 are presented
in the following table. Products are transferred between
operating segments at internal product values that approxi-
mate market prices.
Revenues for the upstream segment are derived primarily
from the production and sale of crude oil and natural gas, as
well as the sale of third-party production of natural gas. Rev-
enues for the downstream segment are derived from the
refi ning and marketing of petroleum products, such as gaso-
line, jet fuel, gas oils, kerosene, lubricants, residual fuel oils
and other products derived from crude oil. This segment
also generates revenues from the transportation and trading
of crude oil and refi ned products. Revenues for the chemicals
segment are derived primarily from the manufacture and sale
of additives for lubricants and fuel. “All Other” activities
include revenues from mining operations of coal and other
minerals, power generation businesses, insurance operations,
real estate activities and technology companies.
Other than the United States, the only country in which
Chevron recorded signifi cant revenues was the United
Kingdom, with revenues of $15,296, $13,985 and $12,121 in
2005, 2004 and 2003, respectively.