Chevron 2005 Annual Report Download - page 52
Download and view the complete annual report
Please find page 52 of the 2005 Chevron annual report below. You can navigate through the pages in the report by either clicking on the pages listed below, or by using the keyword search tool below to find specific information within the annual report.-
 1
1 -
2
-
3
-
4
-
5
-
6
-
7
-
8
-
9
-
10
-
11
-
12
-
13
-
14
-
15
-
16
-
17
-
18
-
19
-
20
-
21
-
22
-
23
-
24
-
25
-
26
-
27
-
28
-
29
-
30
-
31
-
32
-
33
-
34
-
35
-
36
-
37
-
38
-
39
-
40
-
41
-
 42
42 -
 43
43 -
 44
44 -
 45
45 -
 46
46 -
 47
47 -
 48
48 -
 49
49 -
 50
50 -
 51
51 -
 52
52 -
 53
53 -
 54
54 -
 55
55 -
 56
56 -
 57
57 -
 58
58 -
 59
59 -
 60
60 -
 61
61 -
 62
62 -
63
-
64
-
65
-
66
-
67
-
68
-
69
-
70
-
71
-
72
-
73
-
74
-
75
-
76
-
77
-
78
-
79
-
80
-
81
-
82
-
83
-
84
-
85
-
86
-
87
-
88
-
89
-
90
-
91
-
92
-
93
-
94
-
95
-
96
-
97
-
98
-
99
-
100
-
101
-
102
-
103
-
104
-
105
-
106
-
107
-
108
 |
 |

50 CHEVRON CORPORATION 2005 ANNUAL REPORT
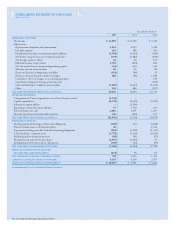
QUARTERLY RESULTS AND STOCK MARKET DATA
Unaudited
2005 2004
Millions of dollars, except per-share amounts 4TH Q 3RD Q 2ND Q 1ST Q 4TH Q 3RD Q 2ND Q 1ST Q
REVENUES AND OTHER INCOME
Sales and other operating revenues1,2 $ 52,457 $ 53,429 $ 47,265 $ 40,490 $ 41,612 $ 39,611 $ 36,579 $ 33,063
Income from equity affiliates 1,110 871 861 889 785 613 740 444
Other income 227 156 217 228 295 496 924 138
TOTAL REVENUES AND OTHER INCOME 53,794 54,456 48,343 41,607 42,692 40,720 38,243 33,645
COSTS AND OTHER DEDUCTIONS
Purchased crude oil and products 34,246 36,101 31,130 26,491 26,290 25,650 22,452 20,027
Operating expenses 3,819 3,190 2,713 2,469 2,874 2,557 2,234 2,167
Selling, general and administrative expenses 1,340 1,337 1,152 999 1,319 1,231 986 1,021
Exploration expenses 274 177 139 153 274 173 165 85
Depreciation, depletion and amortization 1,725 1,534 1,320 1,334 1,283 1,219 1,243 1,190
Taxes other than on income1 5,063 5,282 5,311 5,126 5,216 4,948 4,889 4,765
Interest and debt expense 135 136 104 107 112 107 94 93
Minority interests 33 24 18 21 22 23 18 22
TOTAL COSTS AND OTHER DEDUCTIONS 46,635 47,781 41,887 36,700 37,390 35,908 32,081 29,370
INCOME FROM CONTINUING OPERATIONS
BEFORE INCOME TAX EXPENSE 7,159 6,675 6,456 4,907 5,302 4,812 6,162 4,275
INCOME TAX EXPENSE 3,015 3,081 2,772 2,230 1,862 1,875 2,056 1,724
INCOME FROM CONTINUING OPERATIONS 4,144 3,594 3,684 2,677 3,440 2,937 4,106 2,551
INCOME FROM DISCONTINUED OPERATIONS – – – – – 264 19 11
INCOME BEFORE CUMULATIVE EFFECT OF
CHANGES IN ACCOUNTING PRINCIPLES $ 4,144 $ 3,594 $ 3,684 $ 2,677 $ 3,440 $ 3,201 $ 4,125 $ 2,562
CUMULATIVE EFFECT OF CHANGES IN
ACCOUNTING PRINCIPLES, NET OF TAX – – – – – – – –
NET INCOME3 $ 4,144 $ 3,594 $ 3,684 $ 2,677 $ 3,440 $ 3,201 $ 4,125 $ 2,562
PER-SHARE OF COMMON STOCK4
INCOME FROM CONTINUING OPERATIONS
– BASIC $ 1.88 $ 1.65 $ 1.77 $ 1.28 $ 1.64 $ 1.38 $ 1.93 $ 1.21
– DILUTED $ 1.86 $ 1.64 $ 1.76 $ 1.28 $ 1.63 $ 1.38 $ 1.93 $ 1.20
INCOME FROM DISCONTINUED OPERATIONS
– BASIC $ – $ – $ – $ – $ – $ 0.13 $ 0.01 $ –
– DILUTED $ – $ – $ – $ – $ – $ 0.13 $ 0.01 $ –
CUMULATIVE EFFECT OF CHANGES IN
ACCOUNTING PRINCIPLES
– BASIC $ – $ – $ – $ – $ – $ – $ – $ –
– DILUTED $ – $ – $ – $ – $ – $ – $ – $ –
NET INCOME
– BASIC $ 1.88 $ 1.65 $ 1.77 $ 1.28 $ 1.64 $ 1.51 $ 1.94 $ 1.21
– DILUTED $ 1.86 $ 1.64 $ 1.76 $ 1.28 $ 1.63 $ 1.51 $ 1.94 $ 1.20
DIVIDENDS $ 0.45 $ 0.45 $ 0.45 $ 0.40 $ 0.40 $ 0.40 $ 0.37 $ 0.36
COMMON STOCK PRICE RANGE – HIGH $ 64.45 $ 65.77 $ 59.34 $ 62.08 $ 56.07 $ 54.49 $ 47.50 $ 45.71
– LOW $ 55.75 $ 56.36 $ 50.51 $ 50.55 $ 50.99 $ 46.21 $ 43.95 $ 41.99
1 Includes consumer excise taxes: $ 2,173 $ 2,268 $ 2,162 $ 2,116 $ 2,150 $ 2,040 $ 1,921 $ 1,857
2 Includes amounts for buy/sell contracts: $ 5,897 $ 6,588 $ 5,962 $ 5,375 $ 5,117 $ 4,640 $ 4,637 $ 4,256
3 Net benefi ts (charges) for special items included in
“Net Income”: $ – $ – $ – $ – $ 146 $ 486 $ 585 $ (55)
4 The amounts in all periods refl ect a two-for-one stock split effected as a 100 percent stock dividend in September 2004.
The company’s common stock is listed on the New York Stock Exchange (trading symbol: CVX) and on the Pacific Exchange.
As of February 23, 2006, stockholders of record numbered approximately 230,000. There are no restrictions on the company’s
ability to pay dividends.