Chevron 2005 Annual Report Download - page 92
Download and view the complete annual report
Please find page 92 of the 2005 Chevron annual report below. You can navigate through the pages in the report by either clicking on the pages listed below, or by using the keyword search tool below to find specific information within the annual report.-
 1
1 -
2
-
3
-
4
-
5
-
6
-
7
-
8
-
9
-
10
-
11
-
12
-
13
-
14
-
15
-
16
-
17
-
18
-
19
-
20
-
21
-
22
-
23
-
24
-
25
-
26
-
27
-
28
-
29
-
30
-
31
-
32
-
33
-
34
-
35
-
36
-
37
-
38
-
39
-
40
-
41
-
42
-
43
-
44
-
45
-
46
-
47
-
48
-
49
-
50
-
51
-
52
-
53
-
54
-
55
-
56
-
57
-
58
-
59
-
60
-
61
-
62
-
63
-
64
-
65
-
66
-
67
-
68
-
69
-
70
-
71
-
72
-
73
-
74
-
75
-
76
-
77
-
78
-
79
-
80
-
81
-
 82
82 -
 83
83 -
 84
84 -
 85
85 -
 86
86 -
 87
87 -
 88
88 -
 89
89 -
 90
90 -
 91
91 -
 92
92 -
 93
93 -
 94
94 -
 95
95 -
 96
96 -
 97
97 -
 98
98 -
 99
99 -
 100
100 -
 101
101 -
 102
102 -
103
-
104
-
105
-
106
-
107
-
108
 |
 |

90 CHEVRON CORPORATION 2005 ANNUAL REPORT
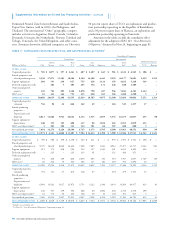
Supplemental Information on Oil and Gas Producing Activities – Continued
TABLE II – CAPITALIZED COSTS RELATED TO OIL AND GAS PRODUCING ACTIVITIES1
Consolidated Companies
United States
International
Gulf of Total Asia- Total Affi liated Companies
Millions of dollars Calif. Mexico Other U.S.
Africa Pacifi c Indonesia Other Int’l. Total TCO Hamaca
AT DEC. 31, 2005
Unproved properties $ 769 $ 1,077 $ 397 $ 2,243 $ 407 $ 2,287 $ 645 $ 983 $ 4,322 $ 6,565 $ 108 $ –
Proved properties and
related producing assets 9,530 17,871 11,103 38,504 8,169 14,308 4,441 9,259 36,177 74,681 2,259 1,212
Support equipment 204 193 230 627 715 426 3,124 356 4,621 5,248 549 –
Deferred exploratory wells – 284 5 289 245 154 173 248 820 1,109 – –
Other uncompleted
projects 149 782 209 1,140 2,878 790 427 946 5,041 6,181 2,332 –
ARO asset2 16 412 364 792 235 620 265 368 1,488 2,280 5 1
GROSS CAP. COSTS 10,668 20,619 12,308 43,595 12,649 18,585 9,075 12,160 52,469 96,064 5,253 1,213
Unproved properties
valuation 736 90 22 848 162 69 – 318 549 1,397 17 –
Proved producing
properties –
Depreciation and
depletion 6,813 13,866 5,943 26,622 4,132 3,915 2,895 5,533 16,475 43,097 455 90
Support equipment
depreciation 140 119 149 408 317 88 1,824 222 2,451 2,859 213 –
ARO asset depreciation2 5 201 106 312 134 101 66 187 488 800 5 –
Accumulated provisions 7,694 14,276 6,220 28,190 4,745 4,173 4,785 6,260 19,963 48,153 690 90
NET CAPITALIZED COSTS $ 2,974 $ 6,343 $ 6,088 $ 15,405 $ 7,904 $ 14,412 $ 4,290 $ 5,900 $ 32,506 $ 47,911 $ 4,563 $ 1,123
AT DEC. 31, 2004
Unproved properties $ 769 $ 380 $ 109 $ 1,258 $ 322 $ 211 $ – $ 970 $ 1,503 $ 2,761 $ 108 $ –
Proved properties and
related producing assets 9,170 16,610 8,660 34,440 7,188 7,485 3,643 8,961 27,277 61,717 2,163 963
Support equipment 211 175 208 594 513 127 3,030 361 4,031 4,625 496 –
Deferred exploratory wells – 225 – 225 213 81 – 152 446 671 – –
Other uncompleted
projects 91 400 169 660 2,050 605 351 391 3,397 4,057 1,749 149
ARO asset2 28 204 70 302 206 113 181 292 792 1,094 20 –
GROSS CAP. COSTS 10,269 17,994 9,216 37,479 10,492 8,622 7,205 11,127 37,446 74,925 4,536 1,112
Unproved properties
valuation 734 111 27 872 118 67 – 294 479 1,351 15 –
Proved producing
properties –
Depreciation and
depletion 6,694 13,562 5,617 25,873 3,753 3,122 2,396 4,933 14,204 40,077 423 43
Support equipment
depreciation 148 107 139 394 268 60 1,802 206 2,336 2,730 190 –
ARO asset depreciation2 24 174 64 262 128 49 36 148 361 623 5 –
Accumulated provisions 7,600 13,954 5,847 27,401 4,267 3,298 4,234 5,581 17,380 44,781 633 43
NET CAPITALIZED COSTS $ 2,669 $ 4,040 $ 3,369 $ 10,078 $ 6,225 $ 5,324 $ 2,971 $ 5,546 $ 20,066 $ 30,144 $ 3,903 $ 1,069
1 Includes assets held for sale.
2 See Note 24, “Asset Retirement Obligations,” beginning on page 83.
Partitioned Neutral Zone between Kuwait and Saudi Arabia,
Papua New Guinea (sold in 2003), the Philippines, and
Thailand. The international “Other” geographic category
includes activities in Argentina, Brazil, Canada, Colombia,
Denmark, Germany, the Netherlands, Norway, Trinidad and
Tobago, Venezuela, the United Kingdom, and other coun-
tries. Amounts shown for affi liated companies are Chevron’s
50 percent equity share of TCO, an exploration and produc-
tion partnership operating in the Republic of Kazakhstan,
and a 30 percent equity share of Hamaca, an exploration and
production partnership operating in Venezuela.
Amounts in the tables exclude the cumulative effect
adjustment for the adoption of FAS 143, “Asset Retirement
Obligations,” discussed in Note 24, beginning on page 83.