Chevron 2005 Annual Report Download - page 98
Download and view the complete annual report
Please find page 98 of the 2005 Chevron annual report below. You can navigate through the pages in the report by either clicking on the pages listed below, or by using the keyword search tool below to find specific information within the annual report.-
 1
1 -
2
-
3
-
4
-
5
-
6
-
7
-
8
-
9
-
10
-
11
-
12
-
13
-
14
-
15
-
16
-
17
-
18
-
19
-
20
-
21
-
22
-
23
-
24
-
25
-
26
-
27
-
28
-
29
-
30
-
31
-
32
-
33
-
34
-
35
-
36
-
37
-
38
-
39
-
40
-
41
-
42
-
43
-
44
-
45
-
46
-
47
-
48
-
49
-
50
-
51
-
52
-
53
-
54
-
55
-
56
-
57
-
58
-
59
-
60
-
61
-
62
-
63
-
64
-
65
-
66
-
67
-
68
-
69
-
70
-
71
-
72
-
73
-
74
-
75
-
76
-
77
-
78
-
79
-
80
-
81
-
82
-
83
-
84
-
85
-
86
-
87
-
 88
88 -
 89
89 -
 90
90 -
 91
91 -
 92
92 -
 93
93 -
 94
94 -
 95
95 -
 96
96 -
 97
97 -
 98
98 -
 99
99 -
 100
100 -
 101
101 -
 102
102 -
 103
103 -
 104
104 -
 105
105 -
 106
106 -
 107
107 -
 108
108
 |
 |

96 CHEVRON CORPORATION 2005 ANNUAL REPORT
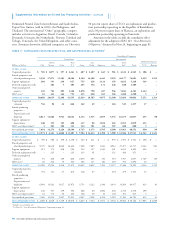
Noteworthy amounts in the categories of proved-
reserve changes for 2003 through 2005 in the table above
are discussed below:
Revisions In 2003, net revisions increased reserves by
57 million barrels for consolidated companies. Whereas net
U.S. reserve changes were minimal, international volumes
increased 66 million barrels. The largest increase was in
Kazakhstan in the Asia-Pacifi c area based on an updated
geologic model for one fi eld. The 200 million-barrel increase
for TCO was based on an updated model of reservoir and
well performance.
In 2004, net revisions decreased reserves 218 million
barrels for consolidated companies and increased reserves
for affi liates by 204 million barrels. For consolidated com-
panies, the decrease was composed of 161 million barrels
for international areas and 57 million barrels for the United
States. The largest downward revision internationally was
70 million barrels in Africa. One fi eld in Angola accounted
for the majority of the net decline as changes were made to
oil-in-place estimates based on reservoir performance data.
One fi eld in the Asia-Pacifi c area essentially accounted for
the 43 million-barrel downward revision for that region. The
revision was associated with reduced well performance. Part
of the 36 million-barrel net downward revision for Indonesia
was associated with the effect of higher year-end prices on
the calculation of reserves for cost-oil recovery under a pro-
TABLE V – RESERVE QUANTITY INFORMATION – Continued
Supplemental Information on Oil and Gas Producing Activities – Continued
NET PROVED RESERVES OF CRUDE OIL, CONDENSATE AND NATURAL GAS LIQUIDS
Consolidated Companies
United States International
Gulf of Total Asia- Total Affi liated Companies
Millions of barrels Calif. Mexico Other U.S. Africa Pacifi c Indonesia Other Int’l. Total TCO Hamaca
RESERVES AT JAN. 1, 2003 1,102 389 626 2,117 1,976 815 889 697 4,377 6,494 1,689 485
Changes attributable to:
Revisions (4) (5) – (9) (1) 105 (57) 19 66 57 200 –
Improved recovery 38 8 7 53 36 – 54 52 142 195 – –
Extensions and discoveries 2 113 9 124 24 15 3 26 68 192 – –
Purchases1 – 1 – 1 – – – 12 12 13 – –
Sales2 (3) (2) (18) (23) – (42) – (1) (43) (66) – –
Production (84) (69) (52) (205) (112) (97) (82) (109) (400) (605) (49) (6)
RESERVES AT DEC. 31, 2003 1,051 435 572 2,058 1,923 796 807 696 4,222 6,280 1,840 479
Changes attributable to:
Revisions 13 (68) (2) (57) (70) (43) (36) (12) (161) (218) 206 (2)
Improved recovery 28 – 6 34 34 – 6 – 40 74 – –
Extensions and discoveries – 8 6 14 77 9 – 17 103 117 – –
Purchases1 – 2 – 2 – – – – – 2 – –
Sales2 – (27) (103) (130) (16) – – (33) (49) (179) – –
Production (81) (56) (47) (184) (115) (86) (79) (101) (381) (565) (52) (9)
RESERVES AT DEC. 31, 2004 1,011 294 432 1,737 1,833 676 698 567 3,774 5,511 1,994 468
Changes attributable to:
Revisions (23) (6) (11) (40) (29) (56) (108) (6) (199) (239) (5) (19)
Improved recovery 57 – 4 61 67 4 42 29 142 203 – –
Extensions and discoveries – 37 7 44 53 21 1 65 140 184 – –
Purchases1 – 49 147 196 4 287 20 65 376 572 – –
Sales2 (1) – (1) (2) – – – (58) (58) (60) – –
Production (79) (41) (45) (165) (114) (103) (74) (89) (380) (545) (50) (14)
RESERVES AT DEC. 31, 20053 965 333 533 1,831 1,814 829 579 573 3,795 5,626 1,939 435
DEVELOPED RESERVES4
At Jan. 1, 2003 867 335 564 1,766 1,042 642 655 529 2,868 4,634 99 63
At Dec. 31, 2003 832 304 515 1,651 1,059 641 588 522 2,810 4,461 1,304 140
At Dec. 31, 2004 832 192 386 1,410 990 543 490 469 2,492 3,902 1,510 188
At Dec. 31, 2005 809 177 474 1,460 945 534 439 416 2,334 3,794 1,611 196
1 Includes reserves acquired through property exchanges.
2 Includes reserves disposed of through property exchanges.
3 Net reserve changes (excluding production) in 2005 consist of 490 million barrels of developed reserves and (170) million barrels of undeveloped reserves for consolidated companies and
(178) million barrels of developed reserves and (154) million barrels of undeveloped reserves for affi liated companies.
4 During 2005, the percentages of undeveloped reserves at December 31, 2004, transferred to developed reserves were 11 percent and 20 percent for consolidated companies and affi liated
companies, respectively.
INFORMATION ON CANADIAN OIL SANDS NET PROVED RESERVES NOT INCLUDED ABOVE:
In addition to conventional liquids and natural gas proved reserves, Chevron has signifi cant interests in proved oil sands reserves in Canada associated with the Athabasca project. For internal
management purposes, Chevron views these reserves and their development as an integral part of total upstream operations. However, SEC regulations defi ne these reserves as mining-related and
not a part of conventional oil and gas reserves. Net proved oil sands reserves were 146 million barrels as of December 31, 2005. The oil sands reserves are not considered in the standardized mea-
sure of discounted future net cash fl ows for conventional oil and gas reserves, which is found on page 101.