Chevron 2005 Annual Report Download - page 79
Download and view the complete annual report
Please find page 79 of the 2005 Chevron annual report below. You can navigate through the pages in the report by either clicking on the pages listed below, or by using the keyword search tool below to find specific information within the annual report.-
 1
1 -
2
-
3
-
4
-
5
-
6
-
7
-
8
-
9
-
10
-
11
-
12
-
13
-
14
-
15
-
16
-
17
-
18
-
19
-
20
-
21
-
22
-
23
-
24
-
25
-
26
-
27
-
28
-
29
-
30
-
31
-
32
-
33
-
34
-
35
-
36
-
37
-
38
-
39
-
40
-
41
-
42
-
43
-
44
-
45
-
46
-
47
-
48
-
49
-
50
-
51
-
52
-
53
-
54
-
55
-
56
-
57
-
58
-
59
-
60
-
61
-
62
-
63
-
64
-
65
-
66
-
67
-
68
-
 69
69 -
 70
70 -
 71
71 -
 72
72 -
 73
73 -
 74
74 -
 75
75 -
 76
76 -
 77
77 -
 78
78 -
 79
79 -
 80
80 -
 81
81 -
 82
82 -
 83
83 -
 84
84 -
 85
85 -
 86
86 -
 87
87 -
 88
88 -
 89
89 -
90
-
91
-
92
-
93
-
94
-
95
-
96
-
97
-
98
-
99
-
100
-
101
-
102
-
103
-
104
-
105
-
106
-
107
-
108
 |
 |

CHEVRON CORPORATION 2005 ANNUAL REPORT 77
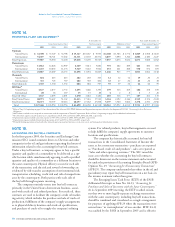
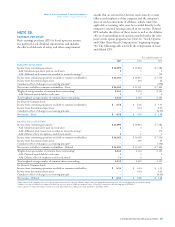
NOTE 21. EMPLOYEE BENEFIT PLANS – Continued
5.5 percent discount rate (shown in the table on page 76)
based on Moody’s Aa Corporate Bond Index and a cash fl ow
analysis using the Citigroup Pension Discount Curve. The
discount rates at the end of 2004 and 2003 were 5.8 percent
and 6 percent, respectively.
Other Benefi t Assumptions For the measurement of accumu-
lated postretirement benefi t obligation at December 31, 2005,
for the main U.S. postretirement medical plan, the assumed
health care cost trend rates start with 10 percent in 2006 and
gradually decline to 5 percent for 2011 and beyond. For this
measurement at December 31, 2004, the assumed health care
cost trend rates started with 9.5 percent in 2005 and gradu-
ally declined to 4.8 percent for 2010 and beyond. In both
measurements, increases in the company’s contributions are
capped at 4 percent effective at retirement.
Assumed health care cost-trend rates have a signifi cant
effect on the amounts reported for retiree health care costs.
A one-percentage-point change in the assumed health care
cost-trend rates would have the following effects:
1 Percent 1 Percent
Increase Decrease
Effect on total service and interest
cost components $ 8 $ (9)
Effect on postretirement benefi t
obligation $ 126 $ (184)
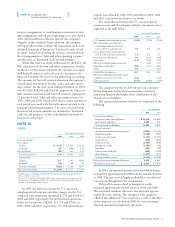
Plan Assets and Investment Strategy The company’s pension
plan weighted-average asset allocations at December 31 by
asset category are as follows:
U.S. International
Asset Category 2005 2004 2005 2004
Equities 69% 70%
60% 57%
Fixed Income 21% 21% 39% 42%
Real Estate 9% 9% 1% 1%
Other 1% – – –
Total 100% 100% 100% 100%
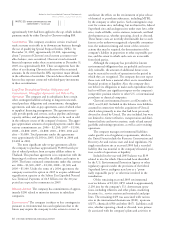
The pension plans invest primarily in asset categories with
suffi cient size, liquidity and cost effi ciency to permit invest-
ments of reasonable size. The pension plans invest in asset
categories that provide diversifi cation benefi ts and are easily
measured. To assess the plans’ investment performance, long-
term asset allocation policy benchmarks have been established.
For the primary U.S. pension plan, the Chevron Board
of Directors has established the following approved asset allo-
cation ranges: Equities 40–70 percent, Fixed Income 20–60
percent, Real Estate 0–15 percent and Other 0–5 percent.
The signifi cant international pension plans also have estab-
lished maximum and minimum asset allocation ranges that
vary by each plan. Actual asset allocation within approved
ranges is based on a variety of current economic and market
conditions and consideration of specifi c asset category risk.
Equities include investments in the company’s common
stock in the amount of $13 and $8 at December 31, 2005
and 2004, respectively. The “Other” asset category includes
minimal investments in private-equity limited partnerships.
Cash Contributions and Benefi t Payments In 2005, the com-
pany contributed $794 and $228 to its U.S. and international
pension plans, respectively. In 2006, the company expects con-
tributions to be approximately $300 and $200 to its U.S. and
international pension plans, respectively. Actual contribution
amounts are dependent upon plan-investment returns, changes
in pension obligations, regulatory environments and other eco-
nomic factors. Additional funding may ultimately be required
if investment returns are insuffi cient to offset increases in plan
obligations.
The company anticipates paying other postretirement
benefi ts of approximately $220 in 2006, as compared with
$226 paid in 2005.
The following benefi t payments, which include estimated
future service, are expected to be paid by the company in the
next ten years:
Pension Benefi ts Other
U.S. Int’l. Benefi ts
2006 $ 788 $ 177 $ 220
2007 $ 639 $ 185 $ 218
2008 $ 674 $ 195 $ 224
2009 $ 714 $ 202 $ 231
2010 $ 729 $ 212 $ 237
2011–2015 $ 3,803 $ 1,240 $ 1,238
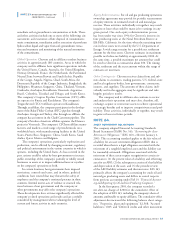
Employee Savings Investment Plan Eligible employees of
Chevron and certain of its subsidiaries participate in the
Chevron Employee Savings Investment Plan (ESIP).
Charges to expense for the ESIP represent the company’s
contributions to the plan, which are funded either through
the purchase of shares of common stock on the open market
or through the release of common stock held in the leveraged
employee stock ownership plan (LESOP), which is discussed
below. Total company matching contributions to employee
accounts within the ESIP were $145, $139 and $136 in 2005,
2004 and 2003, respectively. This cost was reduced by the
value of shares released from the LESOP totaling $(4), $(138)
and $(23) in 2005, 2004 and 2003, respectively. The remain-
ing amounts, totaling $141, $1 and $113 in 2005, 2004 and
2003, respectively, represent open market purchases.
Employee Stock Ownership Plan Within the Chevron
Employee Savings Investment Plan (ESIP) is an employee stock
ownership plan (ESOP). In 1989, Chevron established a lever-
aged employee stock ownership plan (LESOP) as a constituent
part of the ESOP. The LESOP provides partial prefunding of
the company’s future commitments to the ESIP.
As permitted by American Institute of Certifi ed Public
Accountants (AICPA) Statement of Position 93-6, “Employers’
Accounting for Employee Stock Ownership Plans,” the com-
pany has elected to continue its practices, which are based
on AICPA Statement of Position 76-3, “Accounting Practices
for Certain Employee Stock Ownership Plans,” and subsequent
consensus of the EITF of the FASB. The debt of the LESOP