Chevron 2005 Annual Report Download - page 34
Download and view the complete annual report
Please find page 34 of the 2005 Chevron annual report below. You can navigate through the pages in the report by either clicking on the pages listed below, or by using the keyword search tool below to find specific information within the annual report.-
 1
1 -
2
-
3
-
4
-
5
-
6
-
7
-
8
-
9
-
10
-
11
-
12
-
13
-
14
-
15
-
16
-
17
-
18
-
19
-
20
-
21
-
22
-
23
-
 24
24 -
 25
25 -
 26
26 -
 27
27 -
 28
28 -
 29
29 -
 30
30 -
 31
31 -
 32
32 -
 33
33 -
 34
34 -
 35
35 -
 36
36 -
 37
37 -
 38
38 -
 39
39 -
 40
40 -
 41
41 -
 42
42 -
 43
43 -
 44
44 -
45
-
46
-
47
-
48
-
49
-
50
-
51
-
52
-
53
-
54
-
55
-
56
-
57
-
58
-
59
-
60
-
61
-
62
-
63
-
64
-
65
-
66
-
67
-
68
-
69
-
70
-
71
-
72
-
73
-
74
-
75
-
76
-
77
-
78
-
79
-
80
-
81
-
82
-
83
-
84
-
85
-
86
-
87
-
88
-
89
-
90
-
91
-
92
-
93
-
94
-
95
-
96
-
97
-
98
-
99
-
100
-
101
-
102
-
103
-
104
-
105
-
106
-
107
-
108
 |
 |

MANAGEMENT’S DISCUSSION AND ANALYSIS OF
FINANCIAL CONDITION AND RESULTS OF OPERATIONS
32 CHEVRON CORPORATION 2005 ANNUAL REPORT
was associated with property sales, the effects of storms and
normal fi eld declines.
The net liquids component of oil-equivalent production
for 2005 averaged 455,000 barrels per day, a decline of 10
percent from 2004 and 19 percent from 2003. Absent the
effects of the Unocal volumes in 2005, property sales and
storms, net liquids production in 2005 declined 6 percent
and 11 percent from 2004 and 2003, respectively.
Net natural gas production averaged 1.6 billion cubic
feet per day in 2005, down 13 percent and 27 percent from
2004 and 2003, respectively. Excluding the Unocal volumes
in 2005, the effects of property sales and shut-in produc-
tion related to storms, net natural gas production in 2005
declined 10 percent from 2004 and 20 percent from 2003.
Refer to the “Selected Operating Data” table, on page 36,
for the three-year comparative production volumes in the
United States.
No special items were recorded in 2005. Special items
in 2004 included gains of $366 million from property sales,
partially offset by charges of $55 million due to an adverse
litigation matter. Net special charges of $64 million in 2003
were composed of charges of $103 million for asset impair-
ments, associated mainly with the write-down of assets in
anticipation of sale; charges of $38 million for restructuring
and reorganization, mainly for employee severance costs; and
gains of $77 million from property sales.
International Upstream – Exploration and Production
Millions of dollars 2005 2004 2003
Income From Continuing Operations1 $ 7,556 $ 5,622 $ 3,199
Income From Discontinued Operations – 224 21
Cumulative Effect of Accounting
Change – – 145
Total Income2 $ 7,556 $ 5,846 $ 3,365
1 Includes Foreign Currency Effects: $ 14 $ (129) $ (319)
2 Includes Special-Item Gains (Charges):
Asset Dispositions
Continuing Operations $ – $ 644 $ 32
Discontinued Operations – 207 –
Asset Impairments/Write-offs – – (30)
Restructuring and Reorganizations – – (22)
Tax Adjustments – – 118
Total $ – $ 851 $ 98
International upstream income of more than $7.5 billion
in 2005 increased $1.7 billion from $5.8 billion in 2004.
Higher prices for crude oil and natural gas in 2005 and
earnings from the former Unocal operations increased earn-
ings approximately $2.9 billion between periods. About 80
percent of this benefi t arose from the effect of higher prices
on heritage-Chevron production. Partially offsetting these
benefi ts were higher expenses between periods for heritage-
Chevron operations for certain income-tax items, including
the absence of a $200 million benefi t in 2004 relating to
changes in income tax laws. The change between years also
refl ected the impact of $851 million of special-item gains in
2004, while no special items were recorded in 2005. Foreign
currency losses in 2004 were $129 million. Gains of $14 mil-
lion were recorded in 2005.
Income of $5.8 billion in 2004 was nearly $2.5 bil-
lion higher than earnings recorded in 2003. Approximately
$900 million of the increase was the difference between the
effects in each period from special items (discussed below)
and foreign currency losses. Approximately $1.1 billion of
the increase was associated with higher prices for crude oil
and natural gas. Another $400 million resulted from lower
income-tax expense between periods, including a benefi t of
about $200 million in 2004 as a result of changes in income
tax laws. Partially offsetting these effects were higher trans-
portation costs in 2006 of about $200 million. The balance
of the change between periods was associated with a gain in
2003 from the implementation of a new accounting standard.
(Refer to Note 24, beginning on page 83, for a discussion of
FAS 143, “Accounting for Asset Retirement Obligations.”)
Net oil-equivalent production of 1.8 million barrels per
day in 2005, including 143,000 net barrels per day from oil
sands in Canada and production under an operating service
agreement in Venezuela, increased about 6 percent from
2004 and 5 percent from 2003. Absent the net effect of
increased volumes in 2005 from fi ve months of production
from the former Unocal operations, the effect of property
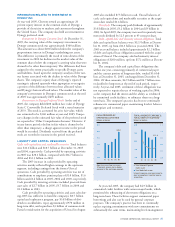
0
1200
900
600
300
0201 03 04 05
$743
EXPLORATION EXPENSES
Millions of dollars
United States
International
Exploration expenses declined
after the October 2001 merger
with Texaco, reflecting, in part,
the high-grading of the combined
exploration portfolio.
0.0
12.5
7.5
10.0
5.0
2.5
0201 03 04 05
$11.7
WORLDWIDE EXPLORATION &
PRODUCTION EARNINGS*
Billions of dollars
Earnings increased in 2005 on
higher prices for crude oil and
natural gas.
*Before the cumulative effect of
changes in accounting principles
but including discontinued
operations
United States
International