Chevron 2005 Annual Report Download - page 6
Download and view the complete annual report
Please find page 6 of the 2005 Chevron annual report below. You can navigate through the pages in the report by either clicking on the pages listed below, or by using the keyword search tool below to find specific information within the annual report.-
 1
1 -
 2
2 -
 3
3 -
 4
4 -
 5
5 -
 6
6 -
 7
7 -
 8
8 -
 9
9 -
 10
10 -
 11
11 -
 12
12 -
 13
13 -
 14
14 -
 15
15 -
 16
16 -
 17
17 -
18
-
19
-
20
-
21
-
22
-
23
-
24
-
25
-
26
-
27
-
28
-
29
-
30
-
31
-
32
-
33
-
34
-
35
-
36
-
37
-
38
-
39
-
40
-
41
-
42
-
43
-
44
-
45
-
46
-
47
-
48
-
49
-
50
-
51
-
52
-
53
-
54
-
55
-
56
-
57
-
58
-
59
-
60
-
61
-
62
-
63
-
64
-
65
-
66
-
67
-
68
-
69
-
70
-
71
-
72
-
73
-
74
-
75
-
76
-
77
-
78
-
79
-
80
-
81
-
82
-
83
-
84
-
85
-
86
-
87
-
88
-
89
-
90
-
91
-
92
-
93
-
94
-
95
-
96
-
97
-
98
-
99
-
100
-
101
-
102
-
103
-
104
-
105
-
106
-
107
-
108
 |
 |

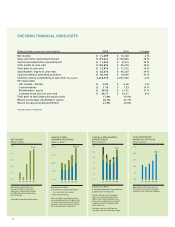
Millions of dollars, except per-share amounts 2005 2004 % Change
Net income $ 14,099 $ 13,328 6 %
Sales and other operating revenues $ 193,641 $ 150,865 28 %
Capital and exploratory expenditures* $ 11,063 $ 8,315 33 %
Total assets at year-end $ 125,833 $ 93,208 35 %
Total debt at year-end $ 12,870 $ 11,272 14 %
Stockholders’ equity at year-end $ 62,676 $ 45,230 39 %
Cash provided by operating activities $ 20,105 $ 14,690 37 %
Common shares outstanding at year-end (Thousands) 2,218,519 2,092,952 6 %
Per-share data
Net income – diluted $ 6.54 $ 6.28 4 %
Cash dividends $ 1.75 $ 1.53 14 %
Stockholders’ equity $ 28.25 $ 21.61 31 %
Common stock price at year-end $ 56.77 $ 52.51 8 %
Total debt to total debt-plus-equity ratio 17.0% 19.9%
Return on average stockholders’ equity 26.1% 32.7%
Return on capital employed (ROCE) 21.9% 25.8%
*Includes equity in affi liates
CHEVRON FINANCIAL HIGHLIGHTS
'%'
)''%'
(,'%'
(''%'
,'%'
J8C<JFK?<I
FG<I8K@E>I<M<EL<J
9`cc`fejf][fccXij
')'( '* '+ ',
(0*%-
JXc\jXe[fk_\ifg\iXk`e^i\m\el\j
`eZi\Xj\[)/g\iZ\ekfe_`^_\igi`Z\j
]fiZil[\f`c#eXkliXc^XjXe[i\]`e\[
gif[lZkj#Xe[k_\`eZclj`fef]LefZXc
]fi]`m\dfek_jgfjk$XZhl`j`k`fe%
:_\d`ZXcjFk_\i
:il[\F`c:fe[\ejXk\#EXkliXc
>XjEXkliXc>XjC`hl`[j
G\kifc\ldGif[lZkj
0.0
12.0
10.0
8.0
6.0
4.0
2.0
CAPITAL & EXPLORATORY
EXPENDITURES*
Billions of dollars
Capital and exploratory expendi-
tures increased 33 percent from
2004. Years 2001 and 2002 were
higher due to additional investments
in equity affiliates Tengizchevroil
and Dynegy Inc.
*Includes equity in affiliates but
excludes cost of Unocal acquisition
Chemicals & Other
Refining, Marketing & Transportation
Exploration & Production
0201 03 04 05
$11.1
'%'
),%'
)'%'
(,%'
('%'
,%'
:8J?GIFM@;<;9P
FG<I8K@E>8:K@M@K@<J
9`cc`fejf][fccXij
Fg\iXk`e^ZXj_]cfn`eZi\Xj\[
*.g\iZ\ekdX`ecp[l\kf_`^_\i
\Xie`e^j`ek_\lgjki\Xdj\^d\ek%
')'( '* '+ ',
)'%(
'%'
(,%'
()%'
0%'
*%'
-%'
E<K@E:FD<!
9`cc`fejf][fccXij
E\k`eZfd\ifj\fek_\Zfe$
k`el\[jki\e^k_f]lgjki\Xd
fg\iXk`fej%Jg\Z`Xc$`k\dZ_Xi^\j
`e)'')i\[lZ\[\Xie`e^jdfi\
k_Xe*Y`cc`fe%
!@eZcl[\j[`jZfek`el\[fg\iXk`fej
'( '* '+ ',
(+%(
')
4