Chevron 2005 Annual Report Download - page 100
Download and view the complete annual report
Please find page 100 of the 2005 Chevron annual report below. You can navigate through the pages in the report by either clicking on the pages listed below, or by using the keyword search tool below to find specific information within the annual report.-
 1
1 -
2
-
3
-
4
-
5
-
6
-
7
-
8
-
9
-
10
-
11
-
12
-
13
-
14
-
15
-
16
-
17
-
18
-
19
-
20
-
21
-
22
-
23
-
24
-
25
-
26
-
27
-
28
-
29
-
30
-
31
-
32
-
33
-
34
-
35
-
36
-
37
-
38
-
39
-
40
-
41
-
42
-
43
-
44
-
45
-
46
-
47
-
48
-
49
-
50
-
51
-
52
-
53
-
54
-
55
-
56
-
57
-
58
-
59
-
60
-
61
-
62
-
63
-
64
-
65
-
66
-
67
-
68
-
69
-
70
-
71
-
72
-
73
-
74
-
75
-
76
-
77
-
78
-
79
-
80
-
81
-
82
-
83
-
84
-
85
-
86
-
87
-
88
-
89
-
 90
90 -
 91
91 -
 92
92 -
 93
93 -
 94
94 -
 95
95 -
 96
96 -
 97
97 -
 98
98 -
 99
99 -
 100
100 -
 101
101 -
 102
102 -
 103
103 -
 104
104 -
 105
105 -
 106
106 -
 107
107 -
 108
108
 |
 |

98 CHEVRON CORPORATION 2005 ANNUAL REPORT
Supplemental Information on Oil and Gas Producing Activities – Continued
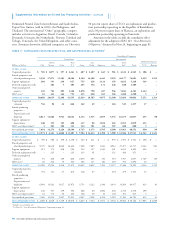
TABLE V – RESERVE QUANTITY INFORMATION – Continued
NET PROVED RESERVES OF NATURAL GAS
Consolidated Companies
United States
International
Gulf of Tota l Asia- Tota l Affi liated Companies
Billions of cubic feet Calif. Mexico Other U.S. Africa Pacifi c Indonesia Other Int’l. Total TCO Hamaca
RESERVES AT JAN. 1, 2003 325 2,052 4,040 6,417 2,298 4,646 518 2,924 10,386 16,803 2,489 43
Changes attributable to:
Revisions 25 (106) (525) (606) 342 879 36 976 2,233 1,627 109 70
Improved recovery 15 7 1 23 17 – 15 35 67 90 – –
Extensions and
discoveries – 270 118 388 3 76 12 47 138 526 – –
Purchases1 – 8 – 8 – 7 – 55 62 70 – –
Sales2 (1) (12) (51) (64) – – – (6) (6) (70) – –
Production (41) (378) (394) (813) (18) (235) (61) (366) (680) (1,493) (72) (1)
RESERVES AT DEC. 31, 2003 323 1,841 3,189 5,353 2,642 5,373 520 3,665 12,200 17,553 2,526 112
Changes attributable to:
Revisions 27 (391) (316) (680) 346 236 21 325 928 248 963 23
Improved recovery 2 – 1 3 7 – 13 – 20 23 – –
Extensions and
discoveries 1 54 89 144 16 39 2 13 70 214 – –
Purchases1 – 5 – 5 – 4 – – 4 9 – –
Sales2 – (147) (289) (436) – – – (111) (111) (547) – –
Production (39) (298) (348) (685) (32) (247) (54) (354) (687) (1,372) (76) (1)
RESERVES AT DEC. 31, 2004 314 1,064 2,326 3,704 2,979 5,405 502 3,538 12,424 16,128 3,413 134
Changes attributable to:
Revisions 21 (15) (15) (9) 211 (428) (31) 243 (5) (14) (547) 49
Improved recovery 8 – – 8 13 – – 31 44 52 – –
Extensions and
discoveries – 68 99 167 25 118 5 55 203 370 – –
Purchases1 – 269 899 1,168 5 3,962 247 274 4,488 5,656 – –
Sales2 – – (6) (6) – – – (248) (248) (254) – –
Production (39) (215) (350) (604) (42) (434) (77) (315) (868) (1,472) (79) (2)
RESERVES AT DEC. 31, 20053 304 1,171 2,953 4,428 3,191 8,623 646 3,578 16,038 20,466 2,787 181
DEVELOPED RESERVES4
At Jan. 1, 2003 266 1,770 3,600 5,636 582 2,934 262 2,157 5,935 11,571 1,474 6
At Dec. 31, 2003 265 1,572 2,964 4,801 954 3,627 223 3,043 7,847 12,648 1,789 52
At Dec. 31, 2004 252 937 2,191 3,380 1,108 3,701 271 2,273 7,353 10,733 2,584 63
At Dec. 31, 2005 251 977 2,794 4,022 1,346 4,819 449 2,453 9,067 13,089 2,314 85
1 Includes reserves acquired through property exchanges.
2 Includes reserves disposed of through property exchanges.
3 Net reserve changes (excluding production) in 2005 consist of 5,141 billion cubic feet of developed reserves and 669 billion cubic feet of undeveloped reserves for consolidated companies and
(672) billion cubic feet of developed reserves and 174 billion cubic feet of undeveloped reserves for affi liated companies.
4 During 2005, the percentages of undeveloped reserves at December 31, 2004, transferred to developed reserves were 12 percent and 19 percent for consolidated companies and affi liated compa-
nies, respectively.
Noteworthy amounts in the categories of proved-reserve
changes for 2003 through 2005 in the table above are dis-
cussed below:
Revisions In 2003, revisions accounted for a net increase
of 1,627 billion cubic feet (BCF) for consolidated compa-
nies, as net increases of 2,233 BCF internationally were
partially offset by net downward revisions of 606 BCF in
the United States. Internationally, the net 879 BCF increase
in the Asia-Pacifi c region related primarily to Australia and
Kazakhstan. In Australia, the increase was associated mainly
with a change to the probabilistic method of aggregating
the reserves for multiple fi elds produced through common
offshore infrastructure into a single LNG plant. The increase
in Kazakhstan related to an updated geologic model for one
fi eld and higher gas sales to a third-party processing plant.
The net 976 BCF increase in the “Other” international area
was mainly the result of operating contract extensions for
two fi elds in South America. In the United States, about
one-third of the net 606 BCF negative revision related to two
coal bed methane fi elds in the Mid-Continent region, based
on performance data for producing wells. Downward revi-
sions for the balance of the write-down were associated with
several fi elds, based on assessments of well performance and
other data.
In 2004, revisions increased reserves for consolidated
companies by a net 248 BCF, composed of increases of
928 BCF internationally and decreases of 680 BCF in the
United States. Internationally, about half of the 346 BCF