Chevron 2005 Annual Report Download - page 35
Download and view the complete annual report
Please find page 35 of the 2005 Chevron annual report below. You can navigate through the pages in the report by either clicking on the pages listed below, or by using the keyword search tool below to find specific information within the annual report.-
 1
1 -
2
-
3
-
4
-
5
-
6
-
7
-
8
-
9
-
10
-
11
-
12
-
13
-
14
-
15
-
16
-
17
-
18
-
19
-
20
-
21
-
22
-
23
-
24
-
 25
25 -
 26
26 -
 27
27 -
 28
28 -
 29
29 -
 30
30 -
 31
31 -
 32
32 -
 33
33 -
 34
34 -
 35
35 -
 36
36 -
 37
37 -
 38
38 -
 39
39 -
 40
40 -
 41
41 -
 42
42 -
 43
43 -
 44
44 -
 45
45 -
46
-
47
-
48
-
49
-
50
-
51
-
52
-
53
-
54
-
55
-
56
-
57
-
58
-
59
-
60
-
61
-
62
-
63
-
64
-
65
-
66
-
67
-
68
-
69
-
70
-
71
-
72
-
73
-
74
-
75
-
76
-
77
-
78
-
79
-
80
-
81
-
82
-
83
-
84
-
85
-
86
-
87
-
88
-
89
-
90
-
91
-
92
-
93
-
94
-
95
-
96
-
97
-
98
-
99
-
100
-
101
-
102
-
103
-
104
-
105
-
106
-
107
-
108
 |
 |
CHEVRON CORPORATION 2005 ANNUAL REPORT 33
sales and the effect of higher prices on cost-recovery and
variable-royalty provisions of certain contracts, oil-equivalent
production in 2005 was essentially the same as 2004 and 2003.
The net liquids component of oil-equivalent production
was 1.4 million barrels per day in 2005, unchanged from
2004 and 2003. Excluding the effects of Unocal production,
property sales and the effect of higher prices on cost-recovery
and variable-royalty volumes, 2005 net liquids production
was essentially the same as 2004 and decreased 1 percent
from 2003.
Net natural gas production of 2.6 billion cubic feet per
day in 2005 was up 25 percent and 26 percent from 2004
and 2003, respectively. Excluding the effect of production
from the Unocal properties, production increased 2 percent
and 3 percent from 2004 and 2003, respectively.
Refer to the “Selected Operating Data” table, on page
36, for the three-year comparative of international produc-
tion volumes.
No special items were recorded in 2005. Special-item
gains in 2004 included $585 million from the sale of produc-
ing properties in western Canada and $266 million from
the sale of other nonstrategic assets, including the company’s
operations in the Democratic Republic of the Congo and
a Canadian natural-gas processing business. In 2003, net
special-item gains of $98 million included benefi ts of $150
million related to income taxes and property sales, partially
offset by asset impairments and charges for employee termi-
nation costs.
U.S. Downstream – Refining, Marketing and Transportation
Millions of dollars 2005 2004 2003
Income* $ 980 $ 1,261 $ 482
*Includes Special-Item Gains (Charges):
Asset Dispositions $ – $ – $ 37
Environmental Remediation Provisions – – (132)
Restructuring and Reorganizations – – (28)
Total $ – $ – $ (123)
U.S. downstream earnings of nearly $1 billion in 2005
decreased about $300 million from 2004 and were up $500
million from 2003. Results in 2003 included net special-
item charges (discussed below) of $123 million. Average
refi ned-product margins in 2005 were higher than in 2004,
and margins in 2004 were signifi cantly higher than in 2003.
However, the effects of increased downtime at refi neries and
other facilities and higher fuel costs dampened earnings in
2005. A portion of the downtime in 2005 was associated
with hurricanes in the Gulf of Mexico. As a result of the
storms, the company’s refi nery in Pascagoula, Mississippi,
was shut down for more than a month, and the company’s
marketing and pipeline operations along the Gulf Coast were
also disrupted for an extended period.
Sales volumes of refi ned products in 2005 were approxi-
mately 1.5 million barrels per day, or about 2 percent lower
than in 2004. Branded gasoline sales volumes of approxi-
mately 600,000 barrels per day increased about 4 percent
from the 2004 period. In 2004, refi ned-product sales volumes
increased about 5 percent from 2003, primarily due to higher
sales of gasoline, diesel fuel and fuel oil. Refer to the “Selected
Operating Data” table, on page 36, for the three-year com-
parative refi ned-product sales volumes in the United States.
In 2003, net special-item charges of $123 million
included $132 million for environmental remediation and
$28 million for employee severance costs associated with the
global downstream restructuring and reorganization. These
charges were partially offset by net gains of $37 million from
asset sales.
International Downstream – Refining, Marketing and Transportation
Millions of dollars 2005 2004 2003
Income1,2 $ 1,786 $ 1,989 $ 685
1 Includes Foreign Currency Effects: $ (24) $ 7 $ (141)
2 Includes Special-Item Charges:
Asset Dispositions $ – $ – $ (24)
Asset Impairments/Write-offs – – (123)
Restructuring and Reorganizations – – (42)
Total $ – $ – $ (189)
The international downstream includes the company’s
consolidated refi ning and marketing businesses, non-U.S. ship-
ping operations, non-U.S. supply and trading activities, and
equity earnings of affi liates, primarily in the Asia-Pacifi c region.
Income of nearly $1.8 billion in 2005 decreased 10
percent from $2 billion in 2004 but was up about $1.1 bil-
lion from 2003. The decrease from the 2004 period was
due mainly to lower sales volumes, higher costs for fuel and
transportation, expenses associated with an explosion and fi re
at a 40 percent-owned, nonoperated terminal in the United
Kingdom, and tax adjustments in various countries. These
items more than offset an improvement in average refi ned-
product margins between periods. The $1.3 billion increase
0
1800
1500
1200
900
600
300
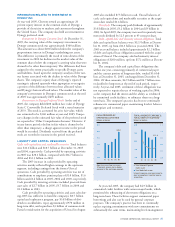
1,473
U.S. GASOLINE &
OTHER REFINED
PRODUCTS SALES*
Thousands of barrels per day
Gasoline
Jet Fuel
Gas Oils & Kerosene
Residual Fuel Oil
Other
Refined products sales volumes
declined about 2 percent from
2004, with lower sales of fuel
oils and other products.
*Includes equity in affiliates
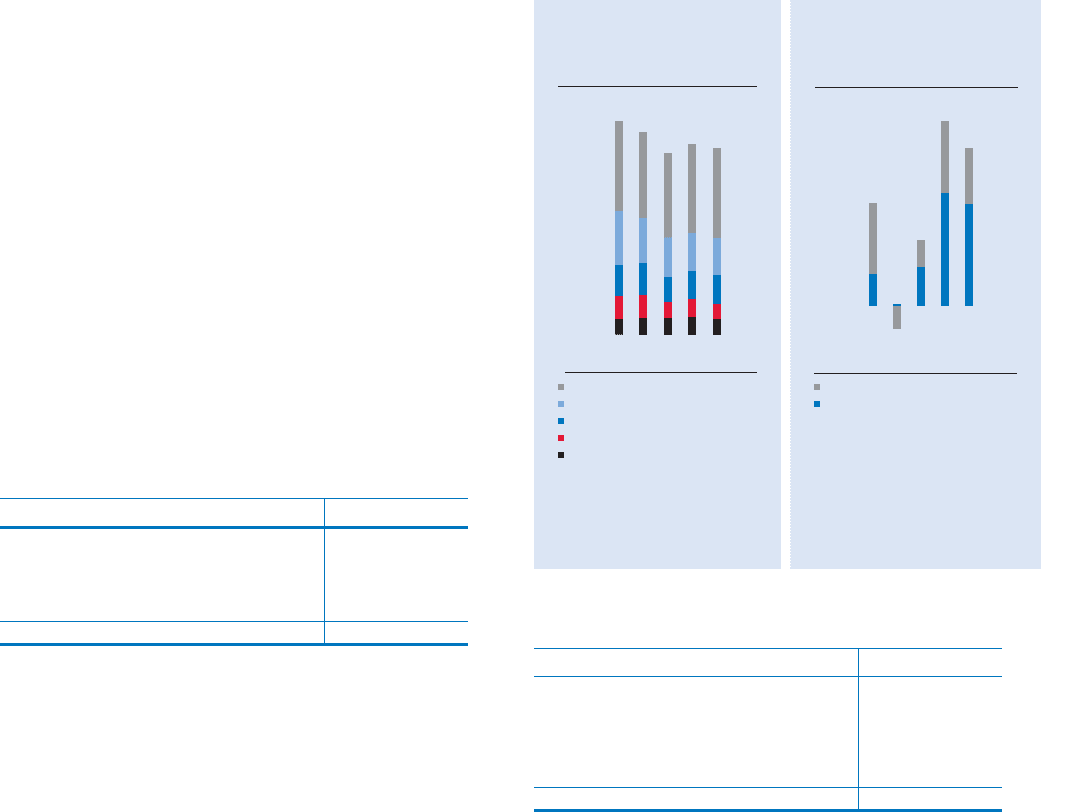
0201 03 04 05
-0.5
3.5
3.0
2.5
0.0
0.5
2.0
1.0
1.5
0201 03 04 05
$2.8
WORLDWIDE REFINING,
MARKETING &
TRANSPORTATION EARNINGS
Billions of dollars
Downstream earnings declined
due to lower international margins
for refined products and U.S.
refinery downtime.
United States
International