Chevron 2005 Annual Report Download - page 68
Download and view the complete annual report
Please find page 68 of the 2005 Chevron annual report below. You can navigate through the pages in the report by either clicking on the pages listed below, or by using the keyword search tool below to find specific information within the annual report.-
 1
1 -
2
-
3
-
4
-
5
-
6
-
7
-
8
-
9
-
10
-
11
-
12
-
13
-
14
-
15
-
16
-
17
-
18
-
19
-
20
-
21
-
22
-
23
-
24
-
25
-
26
-
27
-
28
-
29
-
30
-
31
-
32
-
33
-
34
-
35
-
36
-
37
-
38
-
39
-
40
-
41
-
42
-
43
-
44
-
45
-
46
-
47
-
48
-
49
-
50
-
51
-
52
-
53
-
54
-
55
-
56
-
57
-
 58
58 -
 59
59 -
 60
60 -
 61
61 -
 62
62 -
 63
63 -
 64
64 -
 65
65 -
 66
66 -
 67
67 -
 68
68 -
 69
69 -
 70
70 -
 71
71 -
 72
72 -
 73
73 -
 74
74 -
 75
75 -
 76
76 -
 77
77 -
 78
78 -
79
-
80
-
81
-
82
-
83
-
84
-
85
-
86
-
87
-
88
-
89
-
90
-
91
-
92
-
93
-
94
-
95
-
96
-
97
-
98
-
99
-
100
-
101
-
102
-
103
-
104
-
105
-
106
-
107
-
108
 |
 |

66 CHEVRON CORPORATION 2005 ANNUAL REPORT
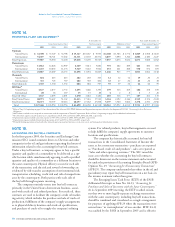
NOTE 8. OPERATING SEGMENTS AND
GEOGRAPHIC DATA – Continued
Year ended December 31
2005 2004 2003
Upstream – Exploration and
Production
United States $ 16,044 $ 8,242 $ 6,842
Intersegment 8,651 8,121 6,295
Total United States 24,695 16,363 13,137
International 10,190 7,246 7,013
Intersegment 13,652 10,184 8,142
Total International 23,842 17,430 15,155
Total Upstream 48,537 33,793 28,292
Downstream – Refi ning,
Marketing and Transportation
United States 73,721 57,723 44,701
Excise taxes 4,521 4,147 3,744
Intersegment 535 179 225
Total United States 78,777 62,049 48,670
International 83,223 67,944 52,486
Excise taxes 4,184 3,810 3,342
Intersegment 14 87 46
Total International 87,421 71,841 55,874
Total Downstream 166,198 133,890 104,544
Chemicals
United States 343 347 323
Intersegment 241 188 129
Total United States 584 535 452
International 760 747 677
Excise taxes 14 11 9
Intersegment 131 107 83
Total International 905 865 769
Total Chemicals 1,489 1,400 1,221
All Other
United States 597 551 338
Intersegment 514 431 121
Total United States 1,111 982 459
International 44 97 100
Intersegment 26 16 4
Total International 70 113 104
Total All Other 1,181 1,095 563
Segment Sales and Other
Operating Revenues
United States 105,167 79,929 62,718
International 112,238 90,249 71,902
Total Segment Sales and Other
Operating Revenues 217,405 170,178 134,620
Elimination of intersegment sales (23,764) (19,313) (15,045)
Total Sales and Other
Operating Revenues* $ 193,641 $ 150,865 $ 119,575
* Includes buy/sell contracts of $23,822 in 2005, $18,650 in 2004 and $14,246 in 2003.
Substantially all of the amounts in each period relates to the downstream segment. Refer to
Note 15, beginning on page 70, for a discussion of the company’s accounting for buy/sell
contracts.
Segment Income Taxes Segment income tax expenses for the
years 2005, 2004 and 2003 are as follows:
Year ended December 31
2005 2004 20031
Upstream – Exploration and
Production
United States $ 2,330 $ 2,308 $ 1,853
International 8,440 5,041 3,831
Total Upstream 10,770 7,349 5,684
Downstream – Refi ning,
Marketing and Transportation
United States 575 739 300
International 576 442 275
Total Downstream 1,151 1,181 575
Chemicals
United States 99 47 (25)
International 25 17 6
Total Chemicals 124 64 (19)
All Other (947) (1,077) (946)
Income Tax Expense From
Continuing Operations2 $ 11,098 $ 7,517 $ 5,294
1 See Note 24, beginning on page 83, for information concerning the cumulative effect of
changes in accounting principles due to the adoption of FAS 143, “Accounting for Asset
Retirement Obligations.”
2 Income tax expense of $100 and $50 related to discontinued operations for 2004 and
2003, respectively, is not included.
Other Segment Information Additional information for
the segmentation of major equity affiliates is contained in
Note 13, beginning on page 68. Information related to proper-
ties, plant and equipment by segment is contained in Note 14,
on page 70.
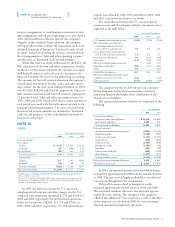
NOTE 9.
LITIGATION
Chevron and many other companies in the petroleum industry
have used methyl tertiary butyl ether (MTBE) as a gasoline
additive. Chevron is a party to more than 70 lawsuits and
claims, the majority of which involve numerous other petro-
leum marketers and refi ners, related to the use of MTBE in
certain oxygenated gasolines and the alleged seepage of MTBE
into groundwater. Resolution of these actions may ultimately
require the company to correct or ameliorate the alleged effects
on the environment of prior release of MTBE by the company
or other parties. Additional lawsuits and claims related to the
use of MTBE, including personal-injury claims, may be fi led in
the future.
The company’s ultimate exposure related to these lawsuits
and claims is not currently determinable, but could be material
to net income in any one period. The company does not use
MTBE in the manufacture of gasoline in the United States.
NOTE 10.
LEASE COMMITMENTS
Certain noncancelable leases are classifi ed as capital leases,
and the leased assets are included as part of “Properties, plant
and equipment, at cost.” Such leasing arrangements involve
tanker charters, crude oil production and processing equip-
ment, service stations, and other facilities. Other leases are
classifi ed as operating leases and are not capitalized. The pay-
Notes to the Consolidated Financial Statements
Millions of dollars, except per-share amounts