Chevron 2005 Annual Report Download - page 7
Download and view the complete annual report
Please find page 7 of the 2005 Chevron annual report below. You can navigate through the pages in the report by either clicking on the pages listed below, or by using the keyword search tool below to find specific information within the annual report.-
 1
1 -
 2
2 -
 3
3 -
 4
4 -
 5
5 -
 6
6 -
 7
7 -
 8
8 -
 9
9 -
 10
10 -
 11
11 -
 12
12 -
 13
13 -
 14
14 -
 15
15 -
 16
16 -
 17
17 -
 18
18 -
19
-
20
-
21
-
22
-
23
-
24
-
25
-
26
-
27
-
28
-
29
-
30
-
31
-
32
-
33
-
34
-
35
-
36
-
37
-
38
-
39
-
40
-
41
-
42
-
43
-
44
-
45
-
46
-
47
-
48
-
49
-
50
-
51
-
52
-
53
-
54
-
55
-
56
-
57
-
58
-
59
-
60
-
61
-
62
-
63
-
64
-
65
-
66
-
67
-
68
-
69
-
70
-
71
-
72
-
73
-
74
-
75
-
76
-
77
-
78
-
79
-
80
-
81
-
82
-
83
-
84
-
85
-
86
-
87
-
88
-
89
-
90
-
91
-
92
-
93
-
94
-
95
-
96
-
97
-
98
-
99
-
100
-
101
-
102
-
103
-
104
-
105
-
106
-
107
-
108
 |
 |

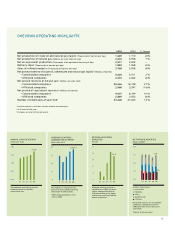
CHEVRON OPERATING HIGHLIGHTS1
2005 2004 % Change
Net production of crude oil and natural gas liquids (Thousands of barrels per day) 1,669 1,710 (2)%
Net production of natural gas (Millions of cubic feet per day) 4,233 3,958 7 %
Net oil-equivalent production (Thousands of oil-equivalent barrels per day) 2,517 2,509 —
Refi nery input (Thousands of barrels per day) 1,883 1,958 (4)%
Sales of refi ned products (Thousands of barrels per day) 3,768 3,908 (4)%
Net proved reserves of crude oil, condensate and natural gas liquids2 (Millions of barrels)
— Consolidated companies 5,626 5,511 2 %
— Affi liated companies 2,374 2,462 (4)%
Net proved reserves of natural gas2 (Billions of cubic feet)
— Consolidated companies 20,466 16,128 27 %
— Affi liated companies 2,968 3,547 (16)%
Net proved oil-equivalent reserves2 (Millions of barrels)
— Conso lidated companies 9,037 8,199 10 %
— Affi liated companies 2,869 3,053 (6)%
Number of employees at year-end3 53,440 47,265 13 %
0.00
2.00
1.50
1.00
0.50
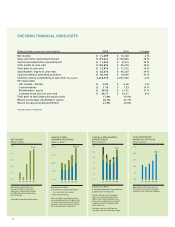
ANNUAL CASH DIVIDENDS
Dollars per share
The company increased its annual
dividend payout for the 18th
consecutive year.
02
01 03 04 05
$1.75
0
60
45
30
15
CHEVRON YEAR-END
COMMON STOCK PRICE*
Dollars per share
The company’s stock price rose
8 percent during 2005, outpacing
the broader market indexes.
*2001–2003 adjusted for stock
split in 2004
0201 03 04 05
$56.77
0
30
24
18
12
6
RETURN ON CAPITAL
EMPLOYED
Percent
Although earnings reached a
record level in 2005, return on
capital employed declined to
21.9 percent due to the higher
capital base resulting from the
Unocal acquisition.
0201 03 04 05
21.9
'%'
()%'
-%'
0%'
*%'
E\kgifm\[i\j\im\j]fiZfejfc`[Xk\[
ZfdgXe`\jZc`dY\[('g\iZ\ek`e
)'',#gi`dXi`cp[l\kfk_\LefZXc
XZhl`j`k`fe%
!9Xii\cjf]f`c$\hl`mXc\ek
E<KGIFM<;I<J<IM<J
9`cc`fejf]9F<!
Fk_\i@ek\ieXk`feXc
8j`X$GXZ`]`Z
@e[fe\j`X
8]i`ZX
Le`k\[JkXk\j
8]]`c`Xk\j
')'( '* '+ ',
0%'
)%0
5
1
Includes equity in affi liates, except number of employees
2 At the end of the year
3 Excludes service station personnel