Zynga 2014 Annual Report Download - page 99
Download and view the complete annual report
Please find page 99 of the 2014 Zynga annual report below. You can navigate through the pages in the report by either clicking on the pages listed below, or by using the keyword search tool below to find specific information within the annual report.-
 1
1 -
2
-
3
-
4
-
5
-
6
-
7
-
8
-
9
-
10
-
11
-
12
-
13
-
14
-
15
-
16
-
17
-
18
-
19
-
20
-
21
-
22
-
23
-
24
-
25
-
26
-
27
-
28
-
29
-
30
-
31
-
32
-
33
-
34
-
35
-
36
-
37
-
38
-
39
-
40
-
41
-
42
-
43
-
44
-
45
-
46
-
47
-
48
-
49
-
50
-
51
-
52
-
53
-
54
-
55
-
56
-
57
-
58
-
59
-
60
-
61
-
62
-
63
-
64
-
65
-
66
-
67
-
68
-
69
-
70
-
71
-
72
-
73
-
74
-
75
-
76
-
77
-
78
-
79
-
80
-
81
-
82
-
83
-
84
-
85
-
86
-
87
-
88
-
 89
89 -
 90
90 -
 91
91 -
 92
92 -
 93
93 -
 94
94 -
 95
95 -
 96
96 -
 97
97 -
 98
98 -
 99
99 -
 100
100 -
 101
101 -
 102
102 -
 103
103 -
 104
104 -
 105
105 -
 106
106 -
 107
107 -
 108
108 -
 109
109 -
110
-
111
-
112
-
113
-
114
-
115
-
116
-
117
-
118
-
119
-
120
-
121
-
122
-
123
-
124
-
125
 |
 |

Table of Contents
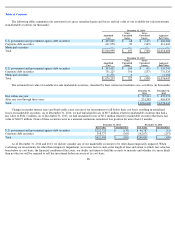
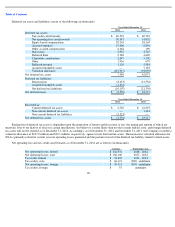
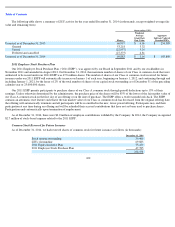
Deferred tax assets and liabilities consist of the following (in thousands):
Realization of deferred tax assets is dependent upon the generation of future taxable income, if any, the timing and amount of which are
uncertain. Due to our history of losses in certain jurisdictions, we believe it is more likely than not that certain federal, state, and foreign deferred
tax assets will not be realized as of December 31, 2014. Accordingly, as of December 31, 2014 and December 31, 2013, the Company recorded a
valuation allowance of $127.9 million and $92.1 million, respectively, against its net deferred tax assets. The increase in valuation allowance for
2014 is primarily related to current year net operating losses generated and the partial reversal of the deferred tax liability related to fixed assets.
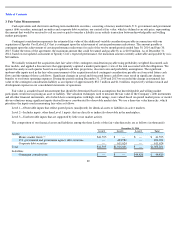
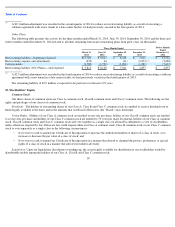
Net operating loss and tax credit carryforwards as of December 31, 2014 are as follows (in thousands):
96
Year Ended December 31,
2014
2013
Deferred tax assets:
Tax credit carryforwards
$
40,501
$
60,745
Net operating loss carryforwards
30,381
14,892
Equity based compensation
28,263
28,164
Accrued expenses
19,406
6,856
Other accrued compensation
6,664
190
State taxes
2,933
2,725
Deferred Rent
2,186
4,620
Charitable contributions
2,047
5,130
Other
1,956
679
Deferred revenue
1,129
5,984
Acquired intangible assets
—
7,183
Valuation allowance
(127,917
)
(92,095
)
Net deferred tax assets
7,549
45,073
Deferred tax liabilities:
Depreciation
(8,453
)
(21,356
)
Acquired intangible assets
(1,654
)
—
Net deferred tax liabilities
(10,107
)
(21,356
)
Net deferred taxes
$
(2,558
)
$
23,717
Year Ended December 31,
2014
2013
Recorded as:
Current deferred tax assets
$
2,765
$
16,293
Non
-
current deferred tax assets
—
7,424
Non
-
current deferred tax liabilities
(5,323
)
—
Net deferred tax assets
$
(2,558
)
$
23,717
Amount
Expiration years
Net operating losses, federal
$
316,931
2028
-
2034
Net operating losses, state
$
306,100
2017
-
2034
Tax credit, federal
$
78,603
2031
-
2034
Tax credits, state
$
66,113
2020
-
indefinite
Net operating losses, foreign
$
59,513
2030
-
indefinite
Tax credits, foreign
$
55
indefinite