Zynga 2014 Annual Report Download - page 65
Download and view the complete annual report
Please find page 65 of the 2014 Zynga annual report below. You can navigate through the pages in the report by either clicking on the pages listed below, or by using the keyword search tool below to find specific information within the annual report.-
 1
1 -
2
-
3
-
4
-
5
-
6
-
7
-
8
-
9
-
10
-
11
-
12
-
13
-
14
-
15
-
16
-
17
-
18
-
19
-
20
-
21
-
22
-
23
-
24
-
25
-
26
-
27
-
28
-
29
-
30
-
31
-
32
-
33
-
34
-
35
-
36
-
37
-
38
-
39
-
40
-
41
-
42
-
43
-
44
-
45
-
46
-
47
-
48
-
49
-
50
-
51
-
52
-
53
-
54
-
 55
55 -
 56
56 -
 57
57 -
 58
58 -
 59
59 -
 60
60 -
 61
61 -
 62
62 -
 63
63 -
 64
64 -
 65
65 -
 66
66 -
 67
67 -
 68
68 -
 69
69 -
 70
70 -
 71
71 -
 72
72 -
 73
73 -
 74
74 -
 75
75 -
76
-
77
-
78
-
79
-
80
-
81
-
82
-
83
-
84
-
85
-
86
-
87
-
88
-
89
-
90
-
91
-
92
-
93
-
94
-
95
-
96
-
97
-
98
-
99
-
100
-
101
-
102
-
103
-
104
-
105
-
106
-
107
-
108
-
109
-
110
-
111
-
112
-
113
-
114
-
115
-
116
-
117
-
118
-
119
-
120
-
121
-
122
-
123
-
124
-
125
 |
 |
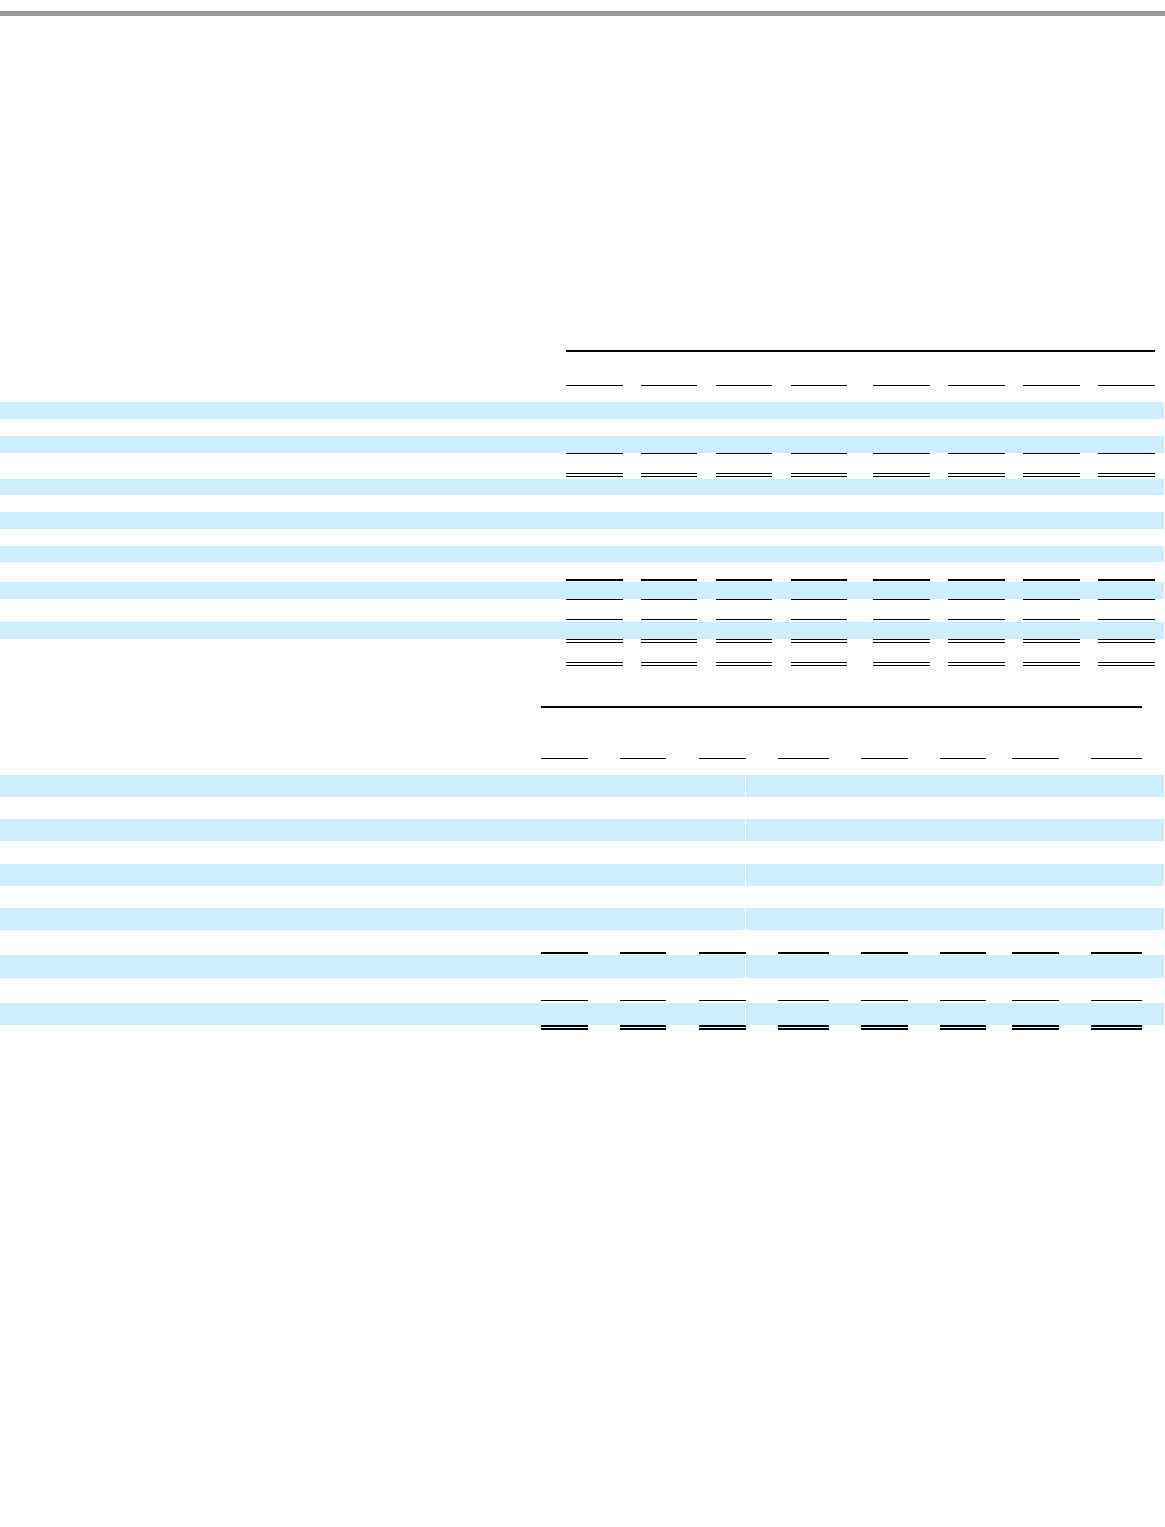
Table of Contents
Quarterly Results of Operations Data
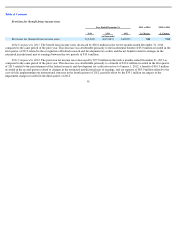
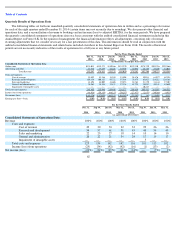
The following tables set forth our unaudited quarterly consolidated statements of operations data in dollars and as a percentage of revenue
for each of the eight quarters ended December 31, 2014 (certain items may not reconcile due to rounding). We also present other financial and
operations data, and a reconciliation of revenue to bookings and net income (loss) to adjusted EBITDA, for the same periods. We have prepared
the quarterly consolidated statements of operations data on a basis consistent with the audited consolidated financial statements included in this
Annual Report on Form 10-K. In the opinion of management, the financial information reflects all adjustments, consisting only of normal
recurring adjustments that we consider necessary for a fair presentation of this data. This information should be read in conjunction with the
audited consolidated financial statements and related notes included elsewhere in this Annual Report on Form 10-K. The results of historical
periods are not necessarily indicative of the results of operations for a full year or any future period.
62
For the Three Months Ended
Dec 31,
2014
Sep 30,
2014
Jun 30,
2014
Mar 31,
2014
Dec 31,
2013
Sep 30,
2013
Jun 30,
2013
Mar 31,
2013
(in thousands, except per share data)
Consolidated Statements of Operations Data:
Online game
$
135,011
$
139,372
$
130,966
$
132,270
$
152,310
$
174,370
$
203,326
$
229,566
Advertising and other
57,536
37,239
22,266
35,750
24,052
28,210
27,409
34,023
Total Revenue
192,547
176,611
153,232
168,020
176,362
202,580
230,735
263,589
Costs and expenses:
Cost of revenue
55,492
53,286
51,288
53,504
58,876
59,011
61,077
69,394
Research and development
105,134
100,113
93,722
97,584
78,475
81,023
124,322
129,181
Sales and marketing
41,898
44,005
41,608
29,853
24,763
21,170
31,163
27,307
General and administrative
38,961
38,536
32,831
57,336
41,725
34,012
44,541
42,640
Impairment of intangible assets
—
—
—
—
—
10,217
—
—
Total costs and expenses
241,485
235,940
219,449
238,277
203,839
205,433
261,103
268,522
Income (loss) from operations
(48,938
)
(59,329
)
(66,217
)
(70,257
)
(27,477
)
(2,853
)
(30,368
)
(4,933
)
Net income (loss)
$
(45,126
)
$
(57,058
)
$
(62,533
)
$
(61,183
)$
(25,242
)
$
(68
)
$
(15,805
)
$
4,133
Earnings per share
—
basic
$
(0.05
)
$
(0.06
)
$
(0.07
)
$
(0.07
)
$
(0.03
)
$
0.00
$
(0.02
)
$
0.01
For the Three Months Ended
Dec 31,
2014
Sep 30,
2014
Jun 30,
2014
Mar 31,
2014
Dec 31,
2013
Sep 30,
2013
Jun 30,
2013
Mar 31,
2013
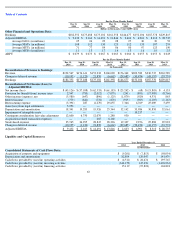
(as a percentage of revenue)
Consolidated Statements of Operations Data:
Revenue
100
%
100
%
100
%
100
%
100
%
100
%
100
%
100
%
Costs and expenses:
Cost of revenue
29
30
33
32
33
29
26
26
Research and development
54
57
61
58
45
40
54
49
Sales and marketing
22
25
27
18
14
10
14
10
General and administrative
20
22
21
34
24
17
19
17
Impairment of intangible assets
—
—
—
—
—
5
—
—
Total costs and expenses
125
134
142
142
116
101
113
102
Income (loss) from operations
(25
)
(34
)
(42
)
(42
)
(16
)
(1
)
(13
)
(2
)
Net income (loss)
(23
%)
(34
%)
(39
%)
(36
%)
(14
%)
—
(
7
%)
2
%