Zynga 2014 Annual Report Download - page 57
Download and view the complete annual report
Please find page 57 of the 2014 Zynga annual report below. You can navigate through the pages in the report by either clicking on the pages listed below, or by using the keyword search tool below to find specific information within the annual report.-
 1
1 -
2
-
3
-
4
-
5
-
6
-
7
-
8
-
9
-
10
-
11
-
12
-
13
-
14
-
15
-
16
-
17
-
18
-
19
-
20
-
21
-
22
-
23
-
24
-
25
-
26
-
27
-
28
-
29
-
30
-
31
-
32
-
33
-
34
-
35
-
36
-
37
-
38
-
39
-
40
-
41
-
42
-
43
-
44
-
45
-
46
-
 47
47 -
 48
48 -
 49
49 -
 50
50 -
 51
51 -
 52
52 -
 53
53 -
 54
54 -
 55
55 -
 56
56 -
 57
57 -
 58
58 -
 59
59 -
 60
60 -
 61
61 -
 62
62 -
 63
63 -
 64
64 -
 65
65 -
 66
66 -
 67
67 -
68
-
69
-
70
-
71
-
72
-
73
-
74
-
75
-
76
-
77
-
78
-
79
-
80
-
81
-
82
-
83
-
84
-
85
-
86
-
87
-
88
-
89
-
90
-
91
-
92
-
93
-
94
-
95
-
96
-
97
-
98
-
99
-
100
-
101
-
102
-
103
-
104
-
105
-
106
-
107
-
108
-
109
-
110
-
111
-
112
-
113
-
114
-
115
-
116
-
117
-
118
-
119
-
120
-
121
-
122
-
123
-
124
-
125
 |
 |

Table of Contents
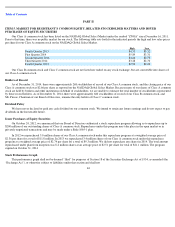
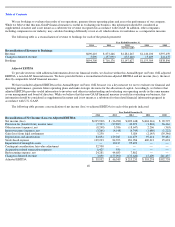
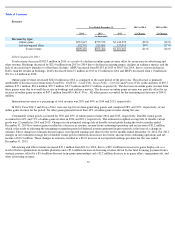
Other Metrics
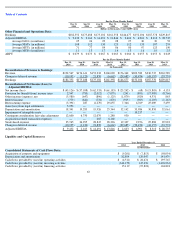
Although our management primarily focuses on the operating metrics above, we also monitor periodic trends in paying players of our
games. The table below shows average monthly unique payer bookings, average MUPs and unique payer bookings per unique payer for the last
eight quarters:
Average monthly unique payer bookings grew during the first and second quarters of 2014 and when comparing the three months ended
December 31, 2014 to December 31, 2013 and declined in the third and fourth quarters of 2014. Growth in average monthly unique payer
bookings in the first and second quarter of 2014 and when comparing the three months ended December 31, 2014 to December 31, 2013 was due
to the bookings contribution from FarmVille 2: Country Escape and Hit it Rich! Slots, both launched on mobile platforms in the first half of
2014. Declines in average monthly unique payer bookings in the third and fourth quarters of 2014 were due to the decline in bookings and users
in our existing web and multiplatform games, such as FarmVille 2 and Zynga Poker, which were not offset by new growth from game launches.
Monthly unique payer bookings per MUP increased to $37 in the fourth quarter of 2014 due to MUP decreasing faster than unique payer
bookings for the period.
Although we monitor our unique payer metrics, we focus on monetization, including through in-game advertising, of all of our players and
not just our payers. Accordingly, we strive to enhance content and our players’ game experience to increase our bookings and ABPU, which is a
measure of overall monetization across all of our players through the sale of virtual goods and advertising.
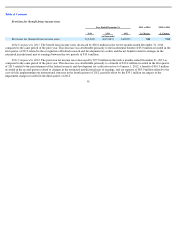
Recent Developments
54
For the Three Months Ended
Dec 31,
2014
Sep 30,
2014
Jun 30,
2014
Mar 31,
2014
Dec 31,
2013
Sep 30,
2013
Jun 30,
2013
Mar 31,
2013
Average monthly unique payer bookings
(in thousands)
$
41,323
$
43,739
$
44,844
$
39,073
$
37,432
$
39,535
$
50,657
$
64,028
Average MUPs (in millions)
1.1
1.3
1.7
1.4
1.3
1.6
1.9
2.5
Monthly unique payer bookings per MUP
$
37
$
33
$
27
$
27
$
28
$
25
$
26
$
26
Average monthly unique payer bookings represent the monthly average amount of bookings for the applicable quarter that we received
through payment methods for which we can quantify the number of unique payers and excludes bookings from certain payment methods for
which we cannot quantify the number of unique payers. Also excluded are bookings from advertising and NaturalMotion.
MUPs exclude NaturalMotion as our systems are unable to distinguish whether a player of a NaturalMotion game is also a player of a Zynga
game so we exclude NaturalMotion payers to avoid potential double counting of MUPs.
Monthly unique payer bookings per MUP is calculated by dividing average monthly unique payer bookings by average MUPs. This
calculation excludes NaturalMotion as we do not have MUP data for NaturalMotion.
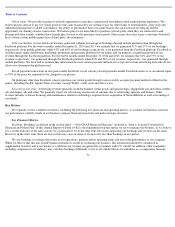
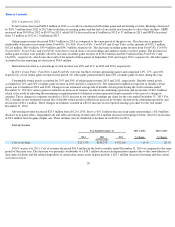
•
Game Launches.
We launched several new games in 2014, including Hit it Rich! Slots, FarmVille 2: Country Escape, NFL
Showdown, New Words with Friends, New Zynga Poker, Wizard of Oz Slots and Looney Tunes Dash! on mobile and New Words
With Friends
on web.
•
Operating Results.
Our operating results declined in 2014 as compared to 2013. Total bookings decreased by 3% and adjusted
EBITDA decreased by 14% compared to 2013. These results primarily reflect the inability of new games to offset the declines in
existing games. While we were able to drive efficiencies and decrease cash operating expenses by $60.5 million, these decreases
were offset by the decrease in bookings.
•
Mobile Growth.
In 2014, we delivered an 80% increase in mobile bookings year over year and a 48% increase in mobile revenue
year over year. This increase was driven by the launch of
FarmVille 2: Country Escape and Hit it Rich! Slots on mobile platforms
and the inclusion of NaturalMotion games in comparison to prior year as our players continued to play our games on their phones
and tablets.
(1)
(2)
(3)
(1)
(2)
(3)