Zynga 2014 Annual Report Download - page 66
Download and view the complete annual report
Please find page 66 of the 2014 Zynga annual report below. You can navigate through the pages in the report by either clicking on the pages listed below, or by using the keyword search tool below to find specific information within the annual report.-
 1
1 -
2
-
3
-
4
-
5
-
6
-
7
-
8
-
9
-
10
-
11
-
12
-
13
-
14
-
15
-
16
-
17
-
18
-
19
-
20
-
21
-
22
-
23
-
24
-
25
-
26
-
27
-
28
-
29
-
30
-
31
-
32
-
33
-
34
-
35
-
36
-
37
-
38
-
39
-
40
-
41
-
42
-
43
-
44
-
45
-
46
-
47
-
48
-
49
-
50
-
51
-
52
-
53
-
54
-
55
-
 56
56 -
 57
57 -
 58
58 -
 59
59 -
 60
60 -
 61
61 -
 62
62 -
 63
63 -
 64
64 -
 65
65 -
 66
66 -
 67
67 -
 68
68 -
 69
69 -
 70
70 -
 71
71 -
 72
72 -
 73
73 -
 74
74 -
 75
75 -
 76
76 -
77
-
78
-
79
-
80
-
81
-
82
-
83
-
84
-
85
-
86
-
87
-
88
-
89
-
90
-
91
-
92
-
93
-
94
-
95
-
96
-
97
-
98
-
99
-
100
-
101
-
102
-
103
-
104
-
105
-
106
-
107
-
108
-
109
-
110
-
111
-
112
-
113
-
114
-
115
-
116
-
117
-
118
-
119
-
120
-
121
-
122
-
123
-
124
-
125
 |
 |
Table of Contents
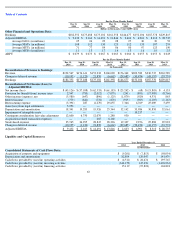
Liquidity and Capital Resources
63
For the Three Months Ended
Dec 31,
2014
Sep 30,
2014
Jun 30,
2014
Mar 31,
2014
Dec 31,
2013
Sep 30,
2013
Jun 30,
2013
Mar 31,
2013
(dollars in thousands, except ABPU data)
Other Financial and Operations Data:
Bookings
$
182,352
$
175,488
$
175,102
$
161,358
$
146,677
$
152,106
$
187,578
$
229,815
Adjusted EBITDA
$
9,432
$
2,163
$
14,491
$
13,846
$
2,603
$
6,901
$
8,310
$
28,735
Average DAUs (in millions)
25
26
29
28
27
30
39
52
Average MAUs (in millions)
108
112
130
123
112
133
187
253
Average MUUs (in millions)
71
77
89
86
80
97
123
150
Average MUPs (in millions)
1.1
1.3
1.7
1.4
1.3
1.6
1.9
2.5
ABPU
$
0.079
$
0.073
$
0.067
$
0.063
$
0.060
$
0.055
$
0.053
$
0.049
For the Three Months Ended
Dec 31,
2014
Sep 30,
2014
Jun 30,
2014
Mar 31,
2014
Dec 31,
2013
Sep 30,
2013
Jun 30,
2013
Mar 31,
2013
(in thousands)
Reconciliation of Revenue to Bookings:
Revenue
$
192,547
$
176,611
$
153,232
$
168,020
$
176,362
$
202,580
$
230,735
$
263,589
Change in deferred revenue
(10,195
)
(1,123
)
21,870
(6,662
)
(29,685
)
(50,474
)
(43,157
)
(33,774
)
Bookings
$
182,352
$
175,488
$
175,102
$
161,358
$
146,677
$
152,106
$
187,578
$
229,815
Reconciliation of Net Income (Loss) to
Adjusted EBITDA:
Net income (loss)
$
(45,126
)
$
(57,058
)
$
(62,533
)
$
(61,183
)
$
(25,242
)
$
(68
)
$
(15,805
)
$
4,133
Provision for (benefit from) income taxes
2,547
(783
)
(2,012
)
(7,079
)
(241
)
(891
)
(17,989
)
(8,766
)
Other income (expense), net
(5,580
)
(647
)
(896
)
(1,125
)
(1,079
)
(929
)
4,531
863
Interest income
(779
)
(841
)
(776
)
(870
)
(915
)
(965
)
(1,105
)
(1,163
)
Restructuring expense
(3,391
)
287
(2,270
)
29,655
7,366
6,769
25,089
5,459
Gain (loss) from legal settlements
5,250
—
—
—
—
—
—
—
Depreciation and amortization
18,341
19,283
19,926
25,344
32,142
33,986
30,858
32,061
Impairment of intangible assets
—
—
—
—
—
10,217
—
—
Contingent consideration fair value adjustment
12,600
6,750
12,070
1,280
930
—
—
—
Acquisition
-
related transaction expenses
—
—
265
6,160
—
—
—
—
Stock
-
based expense
35,765
36,295
28,847
28,326
19,327
9,256
25,888
29,922
Change in deferred revenue
(10,195
)
(1,123
)
21,870
(6,662
)
(29,685
)
(50,474
)
(43,157
)
(33,774
)
Adjusted EBITDA
$
9,432
$
2,163
$
14,491
$
13,846
$
2,603
$
6,901
$
8,310
$
28,735
Year Ended December 31,
2014
2013
2012
(in thousands)
Consolidated Statements of Cash Flows Data:
Acquisition of property and equipment
$
(9,201
)
$
(7,813
)
$
(98,054
)
Depreciation and amortization
82,894
129,047
141,479
Cash flows provided by (used in) operating activities
$
(4,511
)
$
28,674
$
195,767
Cash flows provided by (used in) investing activities
(344,159
)
147,476
(1,496,934
)
Cash flows provided by (used in) financing activities
15,119
(95,818
)
104,818