Zynga 2014 Annual Report Download - page 63
Download and view the complete annual report
Please find page 63 of the 2014 Zynga annual report below. You can navigate through the pages in the report by either clicking on the pages listed below, or by using the keyword search tool below to find specific information within the annual report.-
 1
1 -
2
-
3
-
4
-
5
-
6
-
7
-
8
-
9
-
10
-
11
-
12
-
13
-
14
-
15
-
16
-
17
-
18
-
19
-
20
-
21
-
22
-
23
-
24
-
25
-
26
-
27
-
28
-
29
-
30
-
31
-
32
-
33
-
34
-
35
-
36
-
37
-
38
-
39
-
40
-
41
-
42
-
43
-
44
-
45
-
46
-
47
-
48
-
49
-
50
-
51
-
52
-
 53
53 -
 54
54 -
 55
55 -
 56
56 -
 57
57 -
 58
58 -
 59
59 -
 60
60 -
 61
61 -
 62
62 -
 63
63 -
 64
64 -
 65
65 -
 66
66 -
 67
67 -
 68
68 -
 69
69 -
 70
70 -
 71
71 -
 72
72 -
 73
73 -
74
-
75
-
76
-
77
-
78
-
79
-
80
-
81
-
82
-
83
-
84
-
85
-
86
-
87
-
88
-
89
-
90
-
91
-
92
-
93
-
94
-
95
-
96
-
97
-
98
-
99
-
100
-
101
-
102
-
103
-
104
-
105
-
106
-
107
-
108
-
109
-
110
-
111
-
112
-
113
-
114
-
115
-
116
-
117
-
118
-
119
-
120
-
121
-
122
-
123
-
124
-
125
 |
 |

Table of Contents
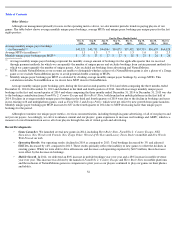
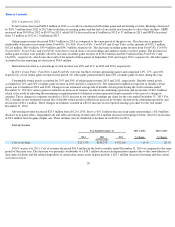
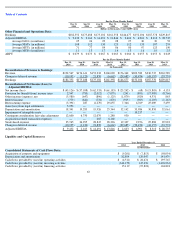
General and administrative
2014 Compared to 2013. General and administrative expenses increased $4.7 million in the twelve months ended December 31, 2014 as
compared to the same period of the prior year. The increase was primarily attributable to a $21.1 million increase in stock-based expense and a
$16.5 million increase due to a lower amount of facilities and overhead costs allocated out, partially offset by a $14.0 million decrease in
headcount-related expense, a $9.8 million decrease in depreciation expense and a $7.1 million decrease in restructuring expense.
2013 Compared to 2012. General and administrative expenses decreased $26.1 million in the twelve months ended December 31, 2013 as
compared to the same period of the prior year. The decrease was primarily attributable to a $30.6 million decrease in stock-based expense
primarily due to forfeiture credits resulting from employee attrition, an $11.0 million decrease in headcount-related expenses, offset by a $17.6
million increase in restructuring expense.
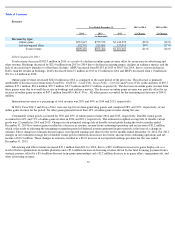
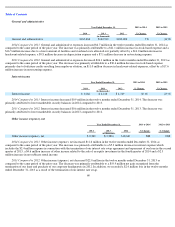
Interest income
2014 Compared to 2013. Interest income decreased $0.9 million in the twelve months ended December 31, 2014. The decrease was
primarily attributed to lower marketable security balances in 2014 compared to 2013.
2013 Compared to 2012. Interest income decreased $0.6 million in the twelve months ended December 31, 2013. The decrease was
primarily attributed to lower marketable security balances in 2013 compared to 2012.
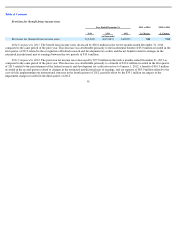
Other income (expense), net
2014 Compared to 2013. Other income (expense), net increased $11.6 million in the twelve months ended December 31, 2014 as
compared to the same period of the prior year. The increase was primarily attributable to a $5.2 million decrease in interest expense which
includes the $2.4 million expense in connection with the termination of our interest rate swap agreement and repayment of our loan in the second
quarter of 2013, a $4.6 million increase of other income related to the sale of an equity investment in the fourth quarter of 2014 and a $2.3
million increase in net sublease rental income.
2013 Compared to 2012. Other income (expense), net decreased $22.0 million in the twelve months ended December 31, 2013 as
compared to the same period of the prior year. The decrease was primarily attributable to a $19.9 million net gain recognized from the
termination of our lease and purchase of our corporate headquarters in 2012. In addition, we recorded a $2.4 million loss in the twelve months
ended December 31, 2013 as a result of the termination of our interest rate swap.
60
Year Ended December 31,
2013 to 2014
% Change
2012 to 2013
% Change
2014
2013
2012
(in thousands)
General and administrative
$
167,664
$
162,918
$
189,004
3
%
(14
)%
Year Ended December 31,
2013 to 2014
% Change
2012 to 2013
% Change
2014
2013
2012
(in thousands)
Interest income
$
3,266
$
4,148
$
4,749
(21
)%
(13
)%
Year Ended December 31,
2013 to 2014
% Change
2012 to 2013
% Change
2014
2013
2012
(in thousands)
Other income (expense), net
$
8,248
$
(3,386
)
$
18,647
NM
NM