Zynga 2014 Annual Report Download - page 67
Download and view the complete annual report
Please find page 67 of the 2014 Zynga annual report below. You can navigate through the pages in the report by either clicking on the pages listed below, or by using the keyword search tool below to find specific information within the annual report.-
 1
1 -
2
-
3
-
4
-
5
-
6
-
7
-
8
-
9
-
10
-
11
-
12
-
13
-
14
-
15
-
16
-
17
-
18
-
19
-
20
-
21
-
22
-
23
-
24
-
25
-
26
-
27
-
28
-
29
-
30
-
31
-
32
-
33
-
34
-
35
-
36
-
37
-
38
-
39
-
40
-
41
-
42
-
43
-
44
-
45
-
46
-
47
-
48
-
49
-
50
-
51
-
52
-
53
-
54
-
55
-
56
-
 57
57 -
 58
58 -
 59
59 -
 60
60 -
 61
61 -
 62
62 -
 63
63 -
 64
64 -
 65
65 -
 66
66 -
 67
67 -
 68
68 -
 69
69 -
 70
70 -
 71
71 -
 72
72 -
 73
73 -
 74
74 -
 75
75 -
 76
76 -
 77
77 -
78
-
79
-
80
-
81
-
82
-
83
-
84
-
85
-
86
-
87
-
88
-
89
-
90
-
91
-
92
-
93
-
94
-
95
-
96
-
97
-
98
-
99
-
100
-
101
-
102
-
103
-
104
-
105
-
106
-
107
-
108
-
109
-
110
-
111
-
112
-
113
-
114
-
115
-
116
-
117
-
118
-
119
-
120
-
121
-
122
-
123
-
124
-
125
 |
 |

Table of Contents
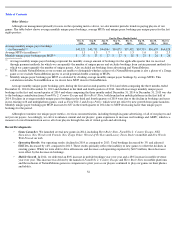
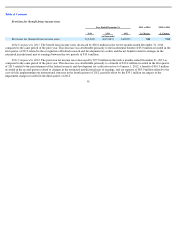
As of December 31, 2014, we had cash, cash equivalents and marketable securities of approximately $1.15 billion, which consisted of
cash, money market funds, U.S. government and government agency debt securities and corporate debt securities. For the full year ended
December 31, 2014, we made capital expenditures of $9.2 million, which included hardware and software to support business operations.
In October 2012, our board of directors authorized a $200 million stock repurchase program. We initiated purchases under this program in
December 2012. In 2012 and 2013 we repurchased an aggregate of 5.0 million shares and 3.4 million shares of our Class A common stock under
this repurchase program at a weighted average price of $2.36 per share and $2.74 per share for a total of $11.8 million and $9.3 million,
respectively. We did not repurchase any shares in 2014. The total amount repurchased under the plan was $21.1 million. The program expired on
October 31, 2014.
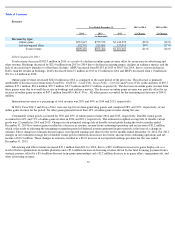
Operating Activities
After our net loss of $225.9 million is adjusted to exclude non-cash items, operating activities used $4.5 million of cash during the twelve
months ended December 31, 2014. Significant non-cash items included stock-
based expense of $129.2 million and depreciation and amortization
of $82.9 million. Depreciation and amortization decreased by $46.2 million as compared to the twelve months ended December 31, 2013 as a
result of fixed assets that were fully depreciated and disposed of and intangible assets that were fully amortized in 2014. Stock-based expense
increased by $44.8 million in the twelve months ended December 31, 2014 as compared to the same period of the prior year primarily due to
grants related to the NaturalMotion acquisition. Net cash provided by operating activities declined $33.2 million when compared to the twelve
months ended December 31, 2013, the decline was primarily due to changes in our operating assets and liabilities in the twelve months ended
December 31, 2014, including changes of $24.6 million and $5.4 million in other liabilities and income tax receivable, respectively, partially
offset by changes of $16.5 million and $6.4 million in accounts receivable and accounts payable, respectively.
After our net loss of $37.0 million is adjusted to exclude non-cash items, operating activities provided $28.7 million of cash during the
twelve months ended December 31, 2013. Significant non-cash items included depreciation and amortization of $129.0 million, stock-based
expense of $84.4 million, accretion and amortization on marketable securities of $17.6 million and impairment of intangible assets of $10.2
million. Depreciation and amortization decreased by $12.5 million as compared to the twelve months ended December 31, 2012 as a result of
fixed assets that were fully depreciated and disposed of and intangible assets that were fully amortized or impaired in 2013. Stock-
based expense
decreased by $197.6 million in the twelve months ended December 31, 2013 as compared to the same period of the prior year primarily due to
increased forfeiture credits resulting from employee attrition in 2013. Net cash provided by operating activities declined $165.0 million primarily
due to changes in our operating assets and liabilities in the twelve months ended December 31, 2013, including a $157.1 million decline in
deferred revenue offset by increases in accounts receivable and other assets.
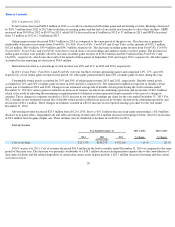
After our net loss of $209.5 million is adjusted to exclude non-cash items, operating activities provided $195.8 million of cash during the
twelve months ended December 31, 2012. Significant non-cash items included stock-based expense of $282.0 million, depreciation and
amortization of $141.5 million and impairment of intangible assets of $95.5 million. Stock-based expense was composed primarily of employee
ZSU and stock option expense and decreased by $318.2 million in the twelve months ended December 31, 2012 as compared to the same period
of the prior year due to expense related to ZSU’s in 2011 as a result of our IPO. Depreciation and amortization increased by $46.1 million as
compared to the twelve months ended December 31, 2011 as a result of our continued investment in property and equipment, including the
purchase of our corporate headquarters building, and business acquisitions. Changes in our operating assets and liabilities used $67.8 million of
cash in the twelve months ended December 31, 2012, primarily due to a decrease in deferred revenue offset by increases in accounts receivable,
other assets and other liabilities. Changes in operating assets and liabilities provided $77.4 million of cash during the twelve months ended
December 31, 2011, primarily due to increases in other liabilities, deferred revenue and accounts payable offset by a decrease in income tax
receivable.
64