Zynga 2014 Annual Report Download - page 78
Download and view the complete annual report
Please find page 78 of the 2014 Zynga annual report below. You can navigate through the pages in the report by either clicking on the pages listed below, or by using the keyword search tool below to find specific information within the annual report.-
 1
1 -
2
-
3
-
4
-
5
-
6
-
7
-
8
-
9
-
10
-
11
-
12
-
13
-
14
-
15
-
16
-
17
-
18
-
19
-
20
-
21
-
22
-
23
-
24
-
25
-
26
-
27
-
28
-
29
-
30
-
31
-
32
-
33
-
34
-
35
-
36
-
37
-
38
-
39
-
40
-
41
-
42
-
43
-
44
-
45
-
46
-
47
-
48
-
49
-
50
-
51
-
52
-
53
-
54
-
55
-
56
-
57
-
58
-
59
-
60
-
61
-
62
-
63
-
64
-
65
-
66
-
67
-
 68
68 -
 69
69 -
 70
70 -
 71
71 -
 72
72 -
 73
73 -
 74
74 -
 75
75 -
 76
76 -
 77
77 -
 78
78 -
 79
79 -
 80
80 -
 81
81 -
 82
82 -
 83
83 -
 84
84 -
 85
85 -
 86
86 -
 87
87 -
 88
88 -
89
-
90
-
91
-
92
-
93
-
94
-
95
-
96
-
97
-
98
-
99
-
100
-
101
-
102
-
103
-
104
-
105
-
106
-
107
-
108
-
109
-
110
-
111
-
112
-
113
-
114
-
115
-
116
-
117
-
118
-
119
-
120
-
121
-
122
-
123
-
124
-
125
 |
 |

Table of Contents
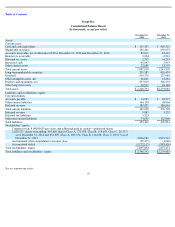
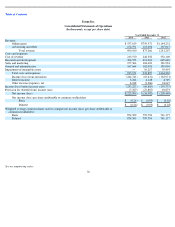
Zynga Inc.
Consolidated Balance Sheets
(In thousands, except par value)
See accompanying notes.
75
December 31,
2014
December 31,
2013
Assets
Current assets:
Cash and cash equivalents
$
131,303
$
465,523
Marketable securities
785,221
659,973
Accounts receivable, net of allowance of $0 at December 31, 2014 and December 31, 2013,
89,611
65,667
Income tax receivable
3,304
6,943
Deferred tax assets
2,765
16,293
Restricted cash
48,047
3,493
Other current assets
22,688
23,507
Total current assets
1,082,939
1,241,399
Long
-
term marketable securities
231,385
416,474
Goodwill
650,778
227,989
Other intangible assets, net
66,861
18,282
Property and equipment, net
297,919
348,793
Other long
-
term assets
18,911
26,148
Total assets
$
2,348,793
$
2,279,085
Liabilities and stockholders
’
equity
Current liabilities:
Accounts payable
$
14,965
$
20,973
Other current liabilities
164,150
68,866
Deferred revenue
189,923
186,663
Total current liabilities
369,038
276,502
Deferred revenue
3,882
3,252
Deferred tax liabilities
5,323
—
Other non
-
current liabilities
74,858
122,060
Total liabilities
453,101
401,814
Stockholders
’
equity:
Common stock, $.00000625 par value, and additional paid in capital
—
authorized shares:
2,020,517; shares outstanding: 905,860 shares (Class A, 770,658, Class B, 114,685, Class C, 20,517)
as of December 31, 2014 and 832,309 (Class A, 685,554, Class B, 126,238, Class C, 20,517) as of
December 31, 2013
3,096,982
2,823,743
Accumulated other comprehensive income (loss)
(29,175
)
(1,046
)
Accumulated deficit
(1,172,115
)
(945,426
)
Total stockholders
’
equity
1,895,692
1,877,271
Total liabilities and stockholders
’
equity
$
2,348,793
$
2,279,085